Channelnomics
Channelnomics is a market consulting company based in Port Washington, NY. They work primarily with large tech companies on market research and analysis to identify the best strategies and routes to market. My work with them revolved around both internal and external marketing and ensuring the in-depth research they did was well presented and communicated a sophisticated and knowledgeable message. I designed reports, presentations, infographics, and advertisements for both print and web. Throughout these projects, the major challenge was to generate intrigue and attract attention with large amounts of data through "sophisticated and clean" design.
Major Reports and Briefs
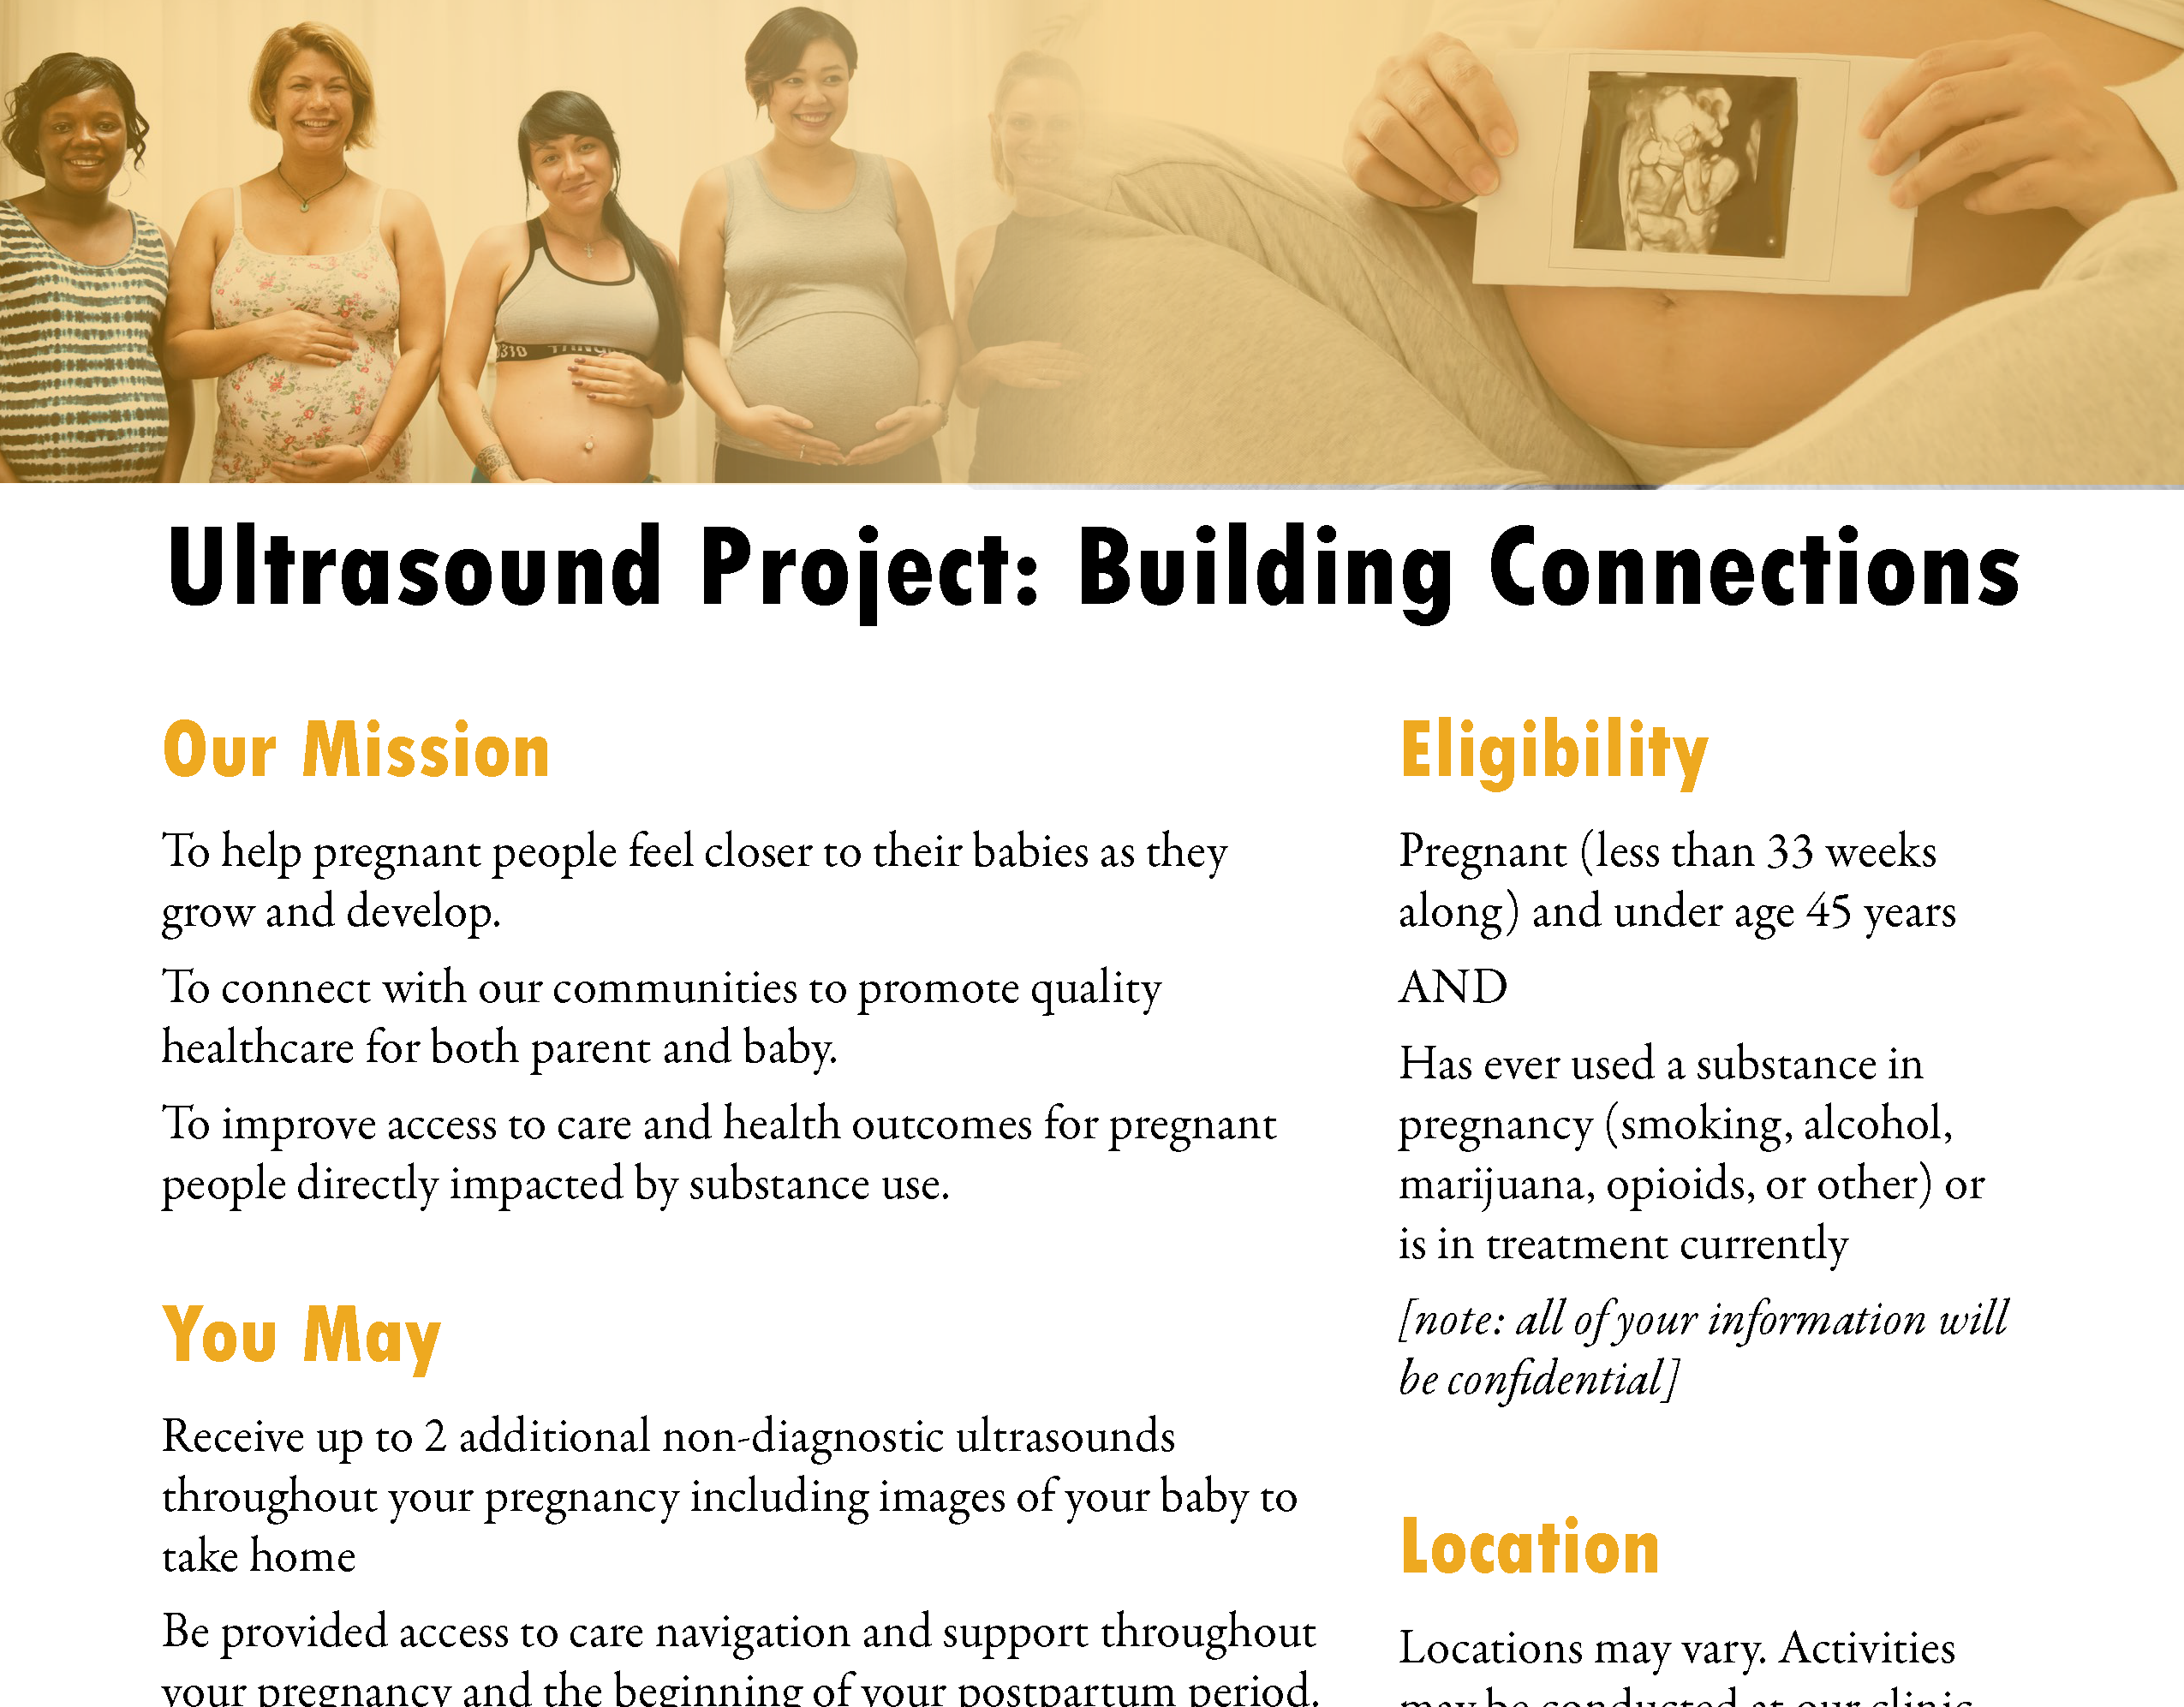
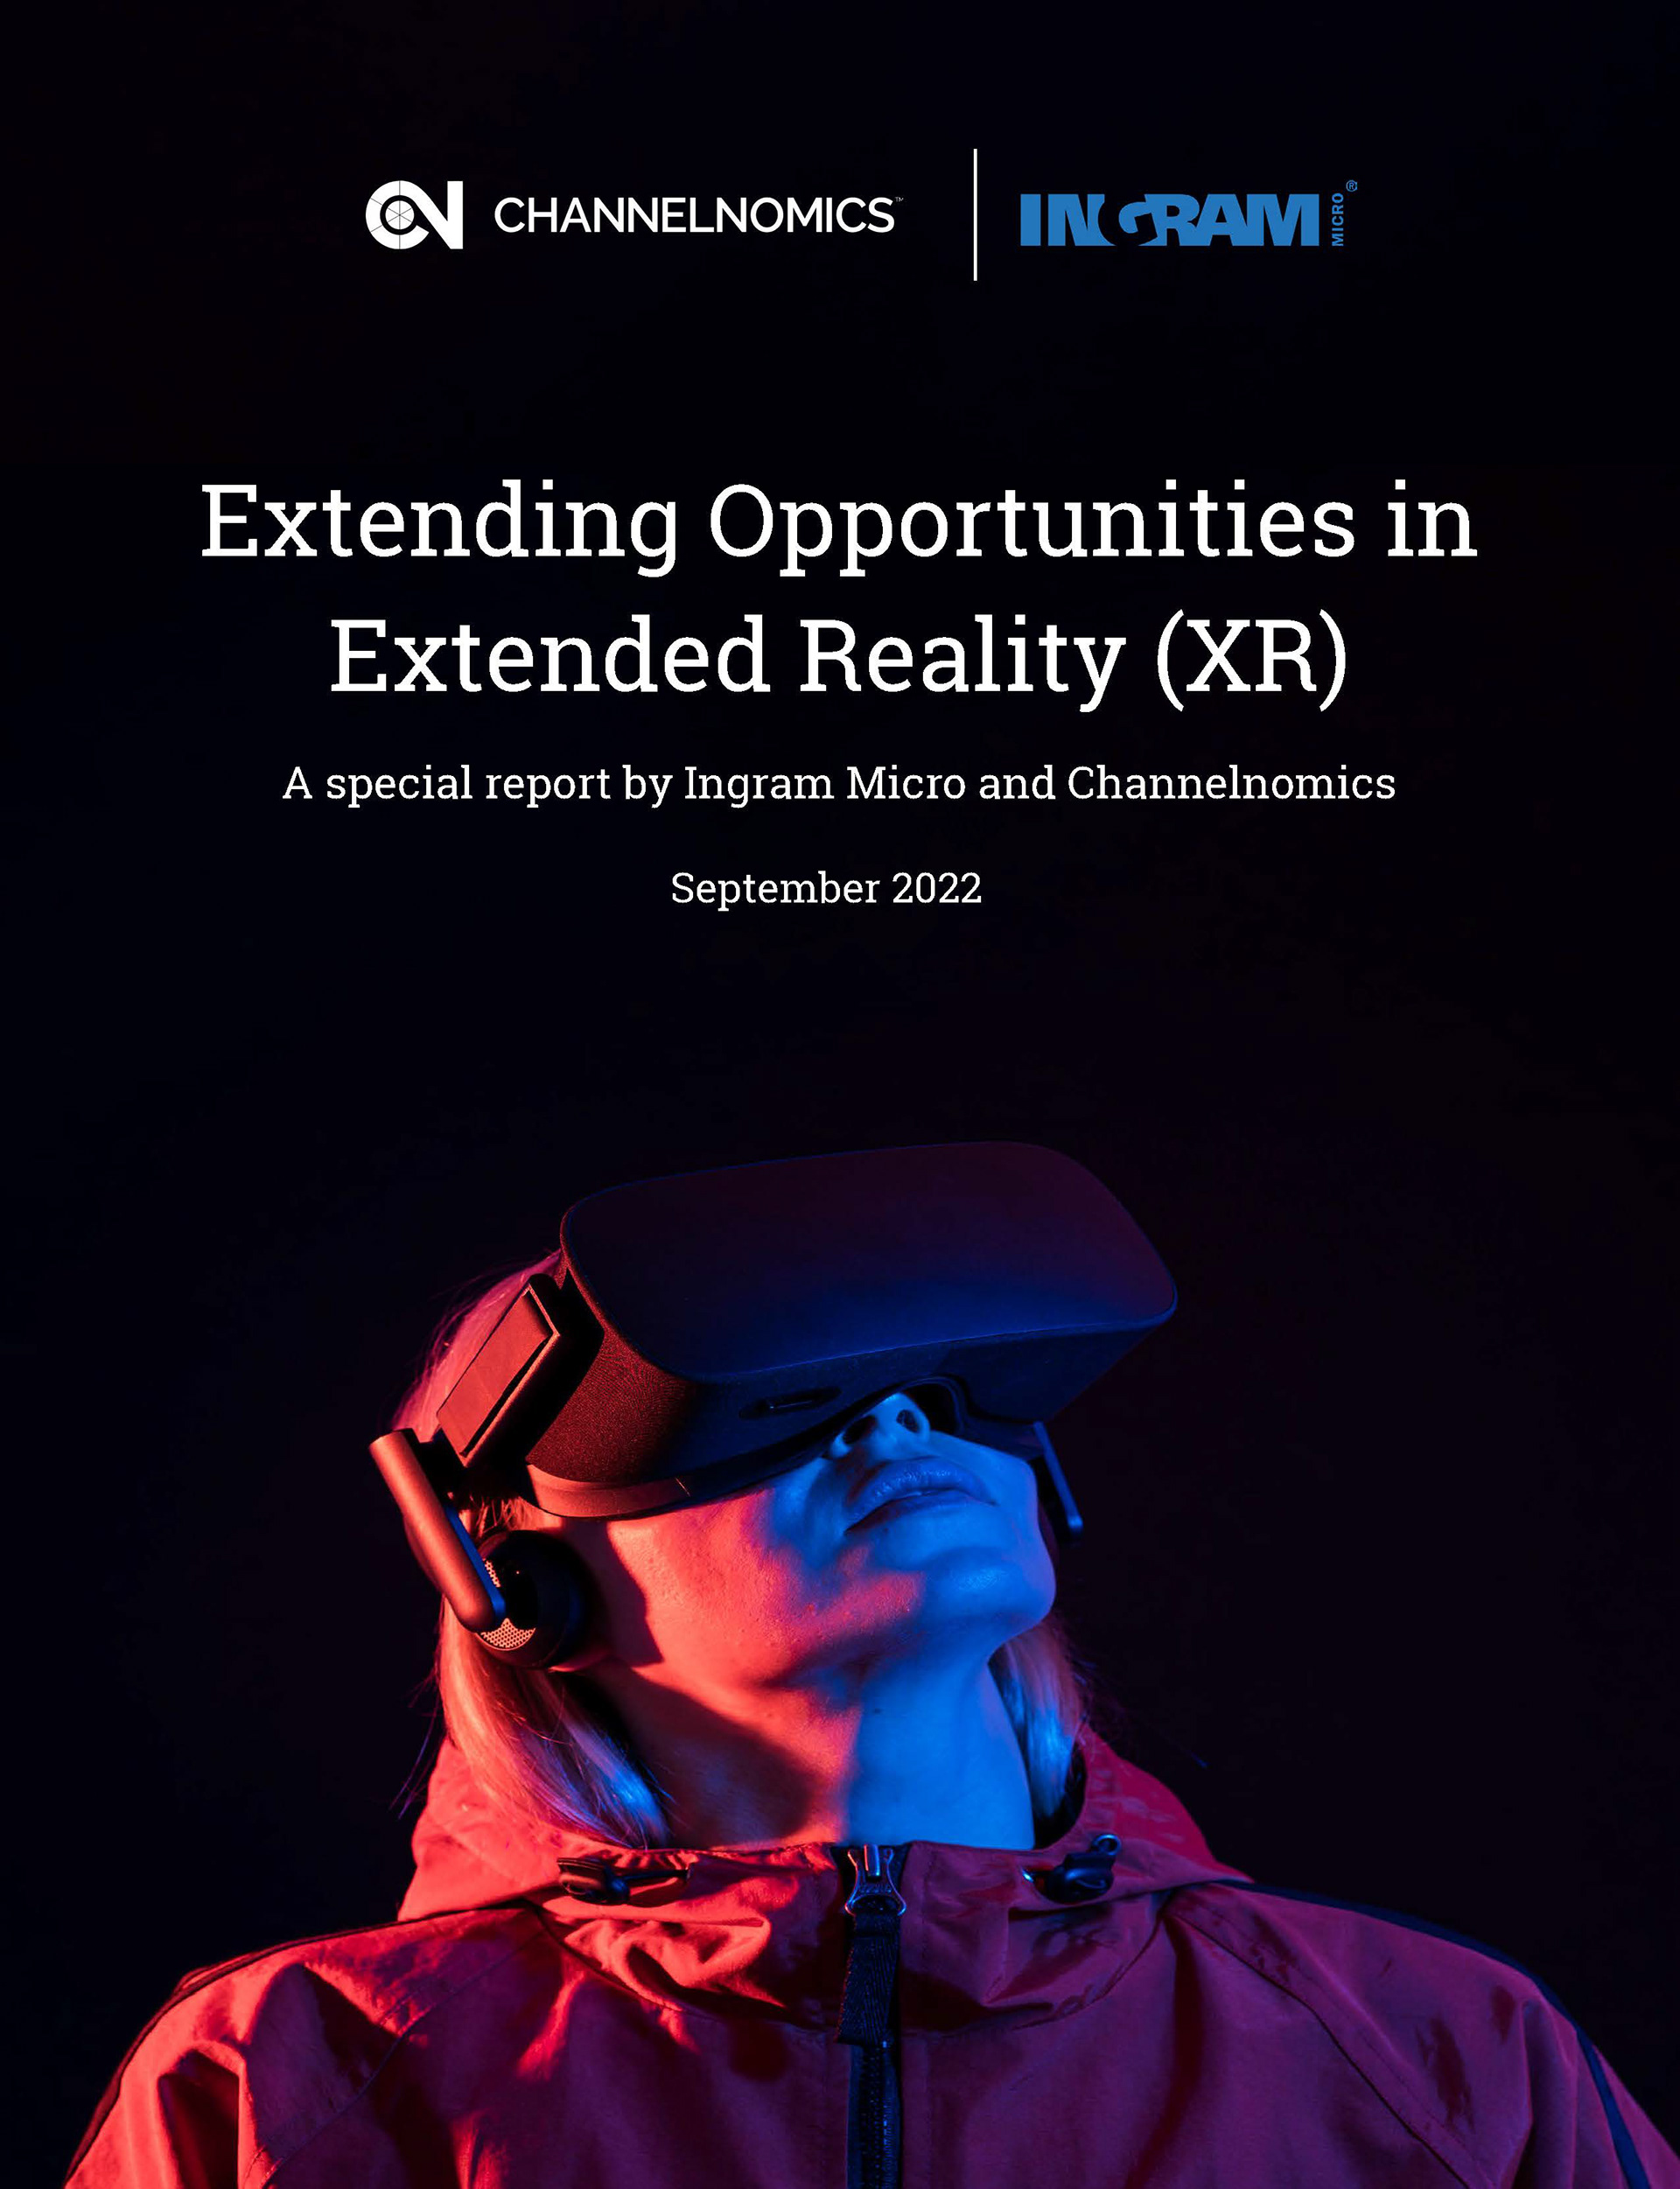
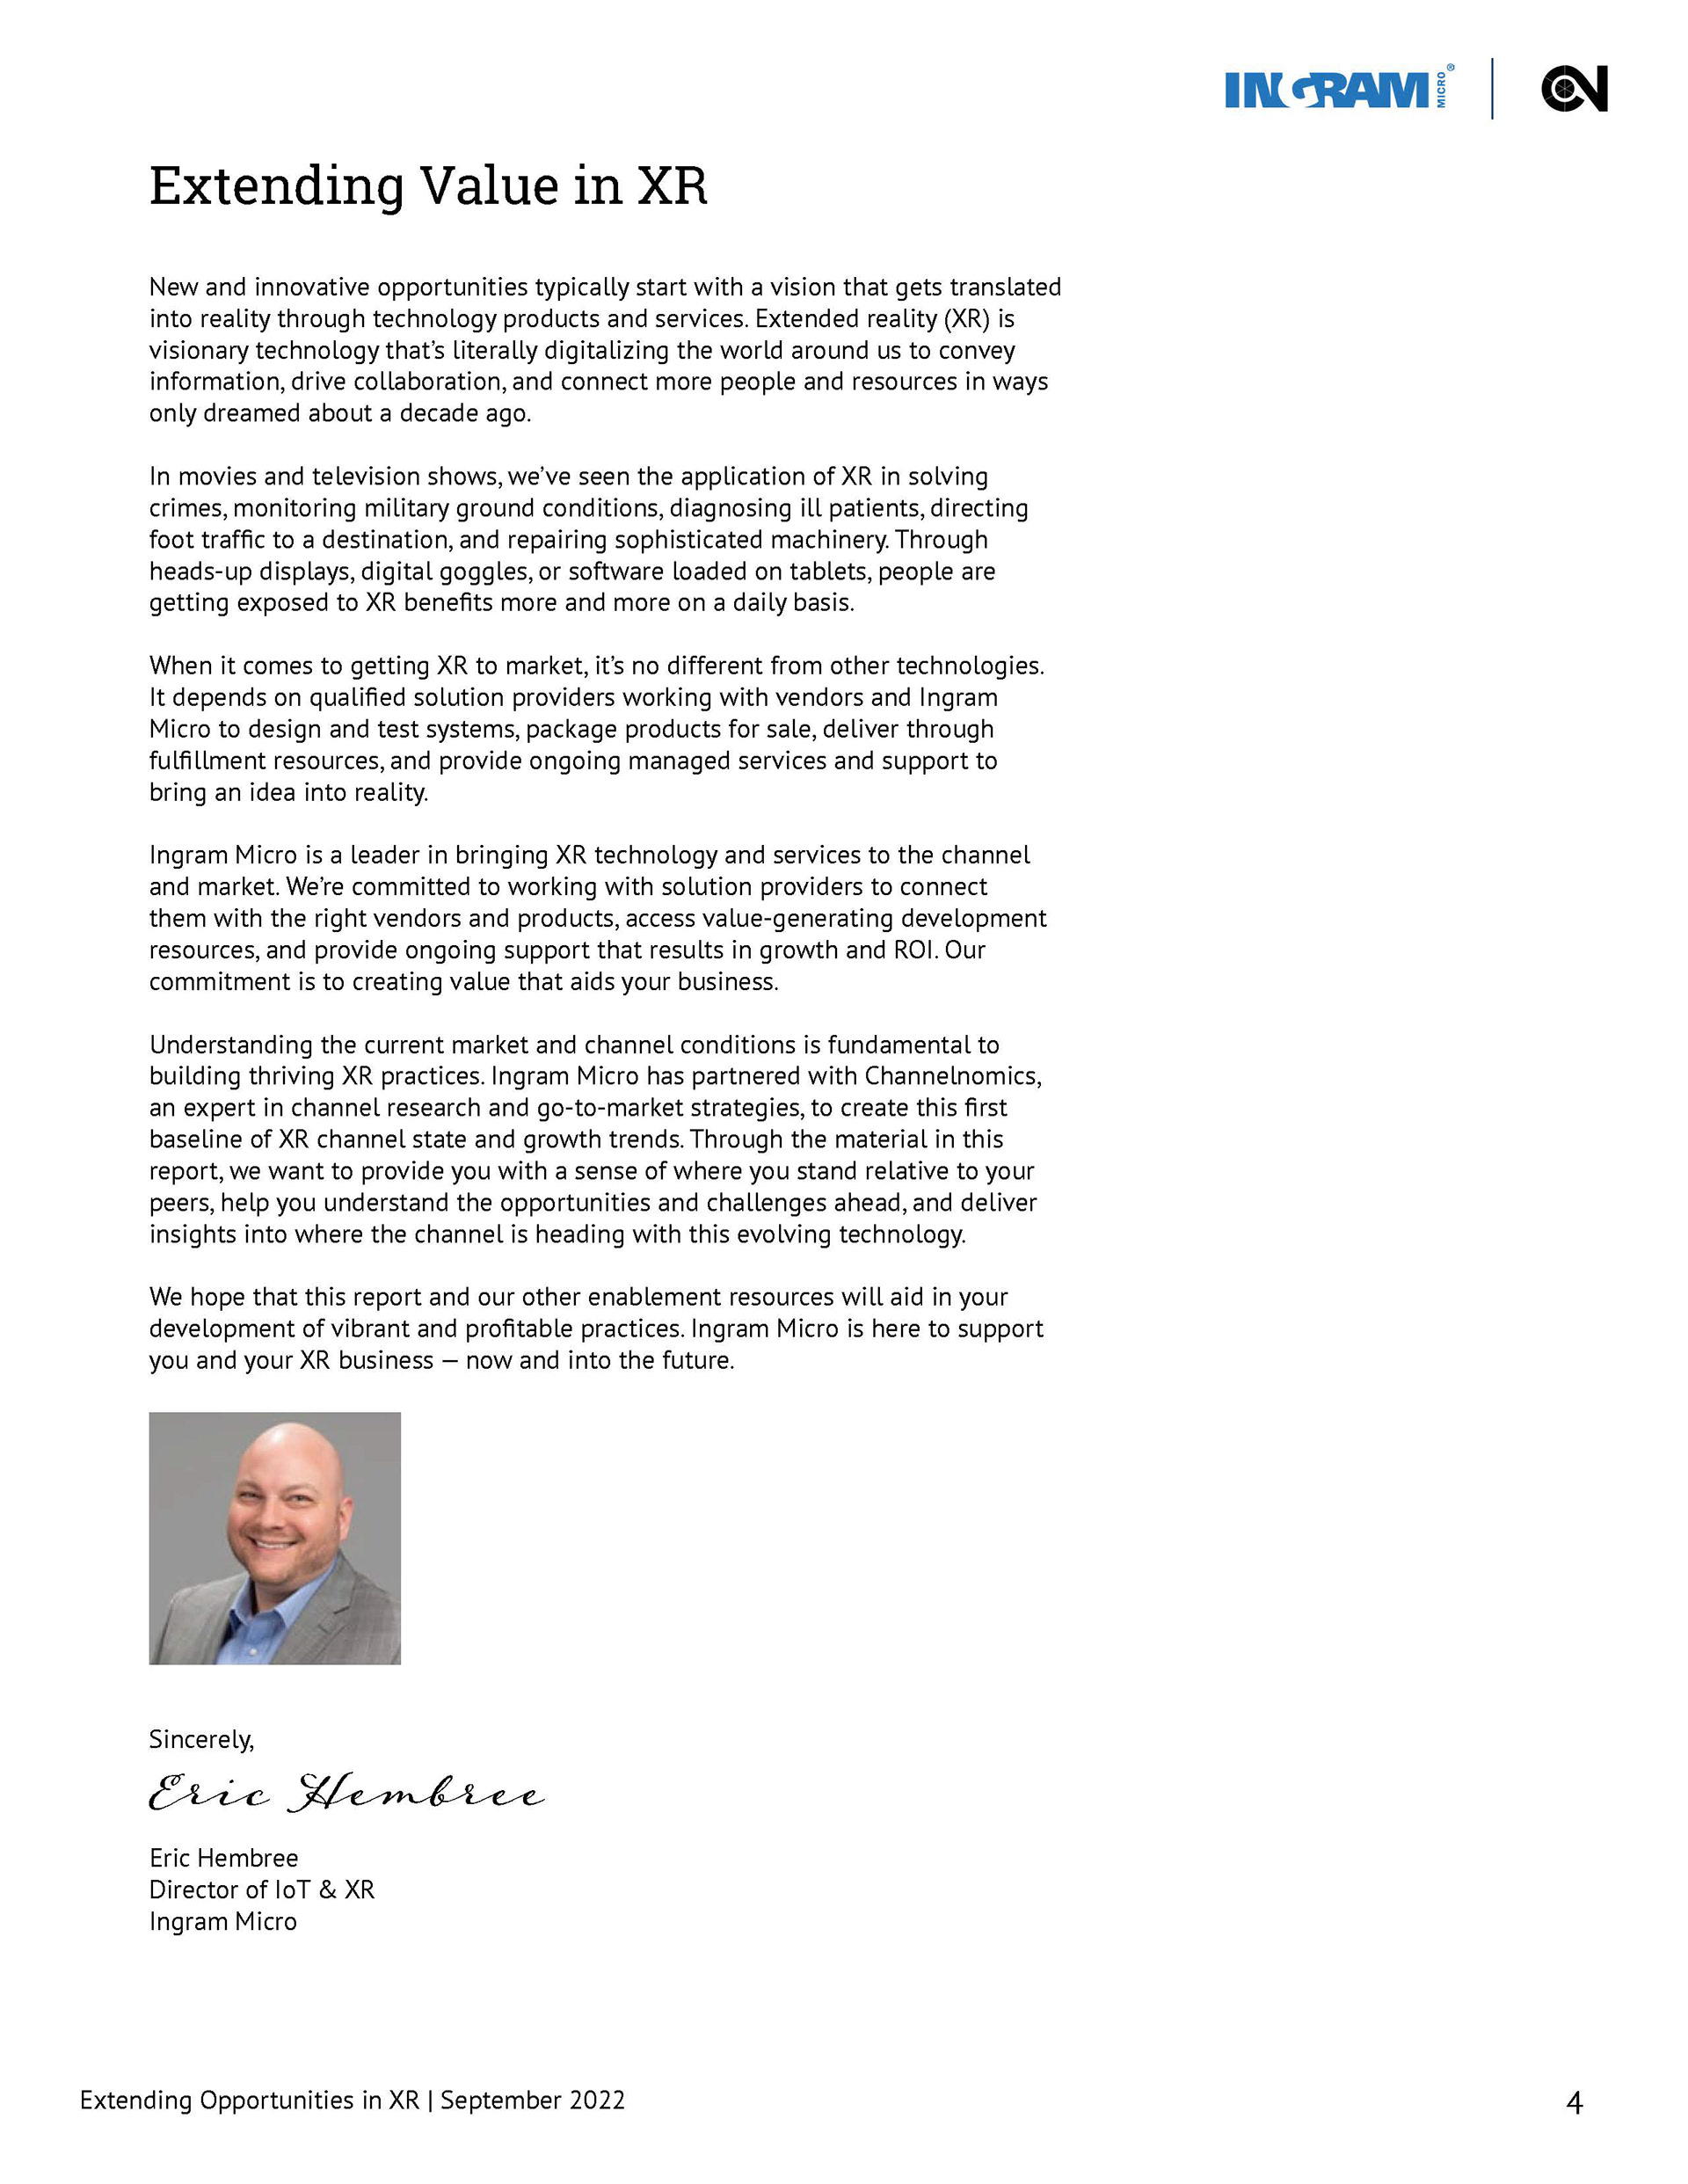
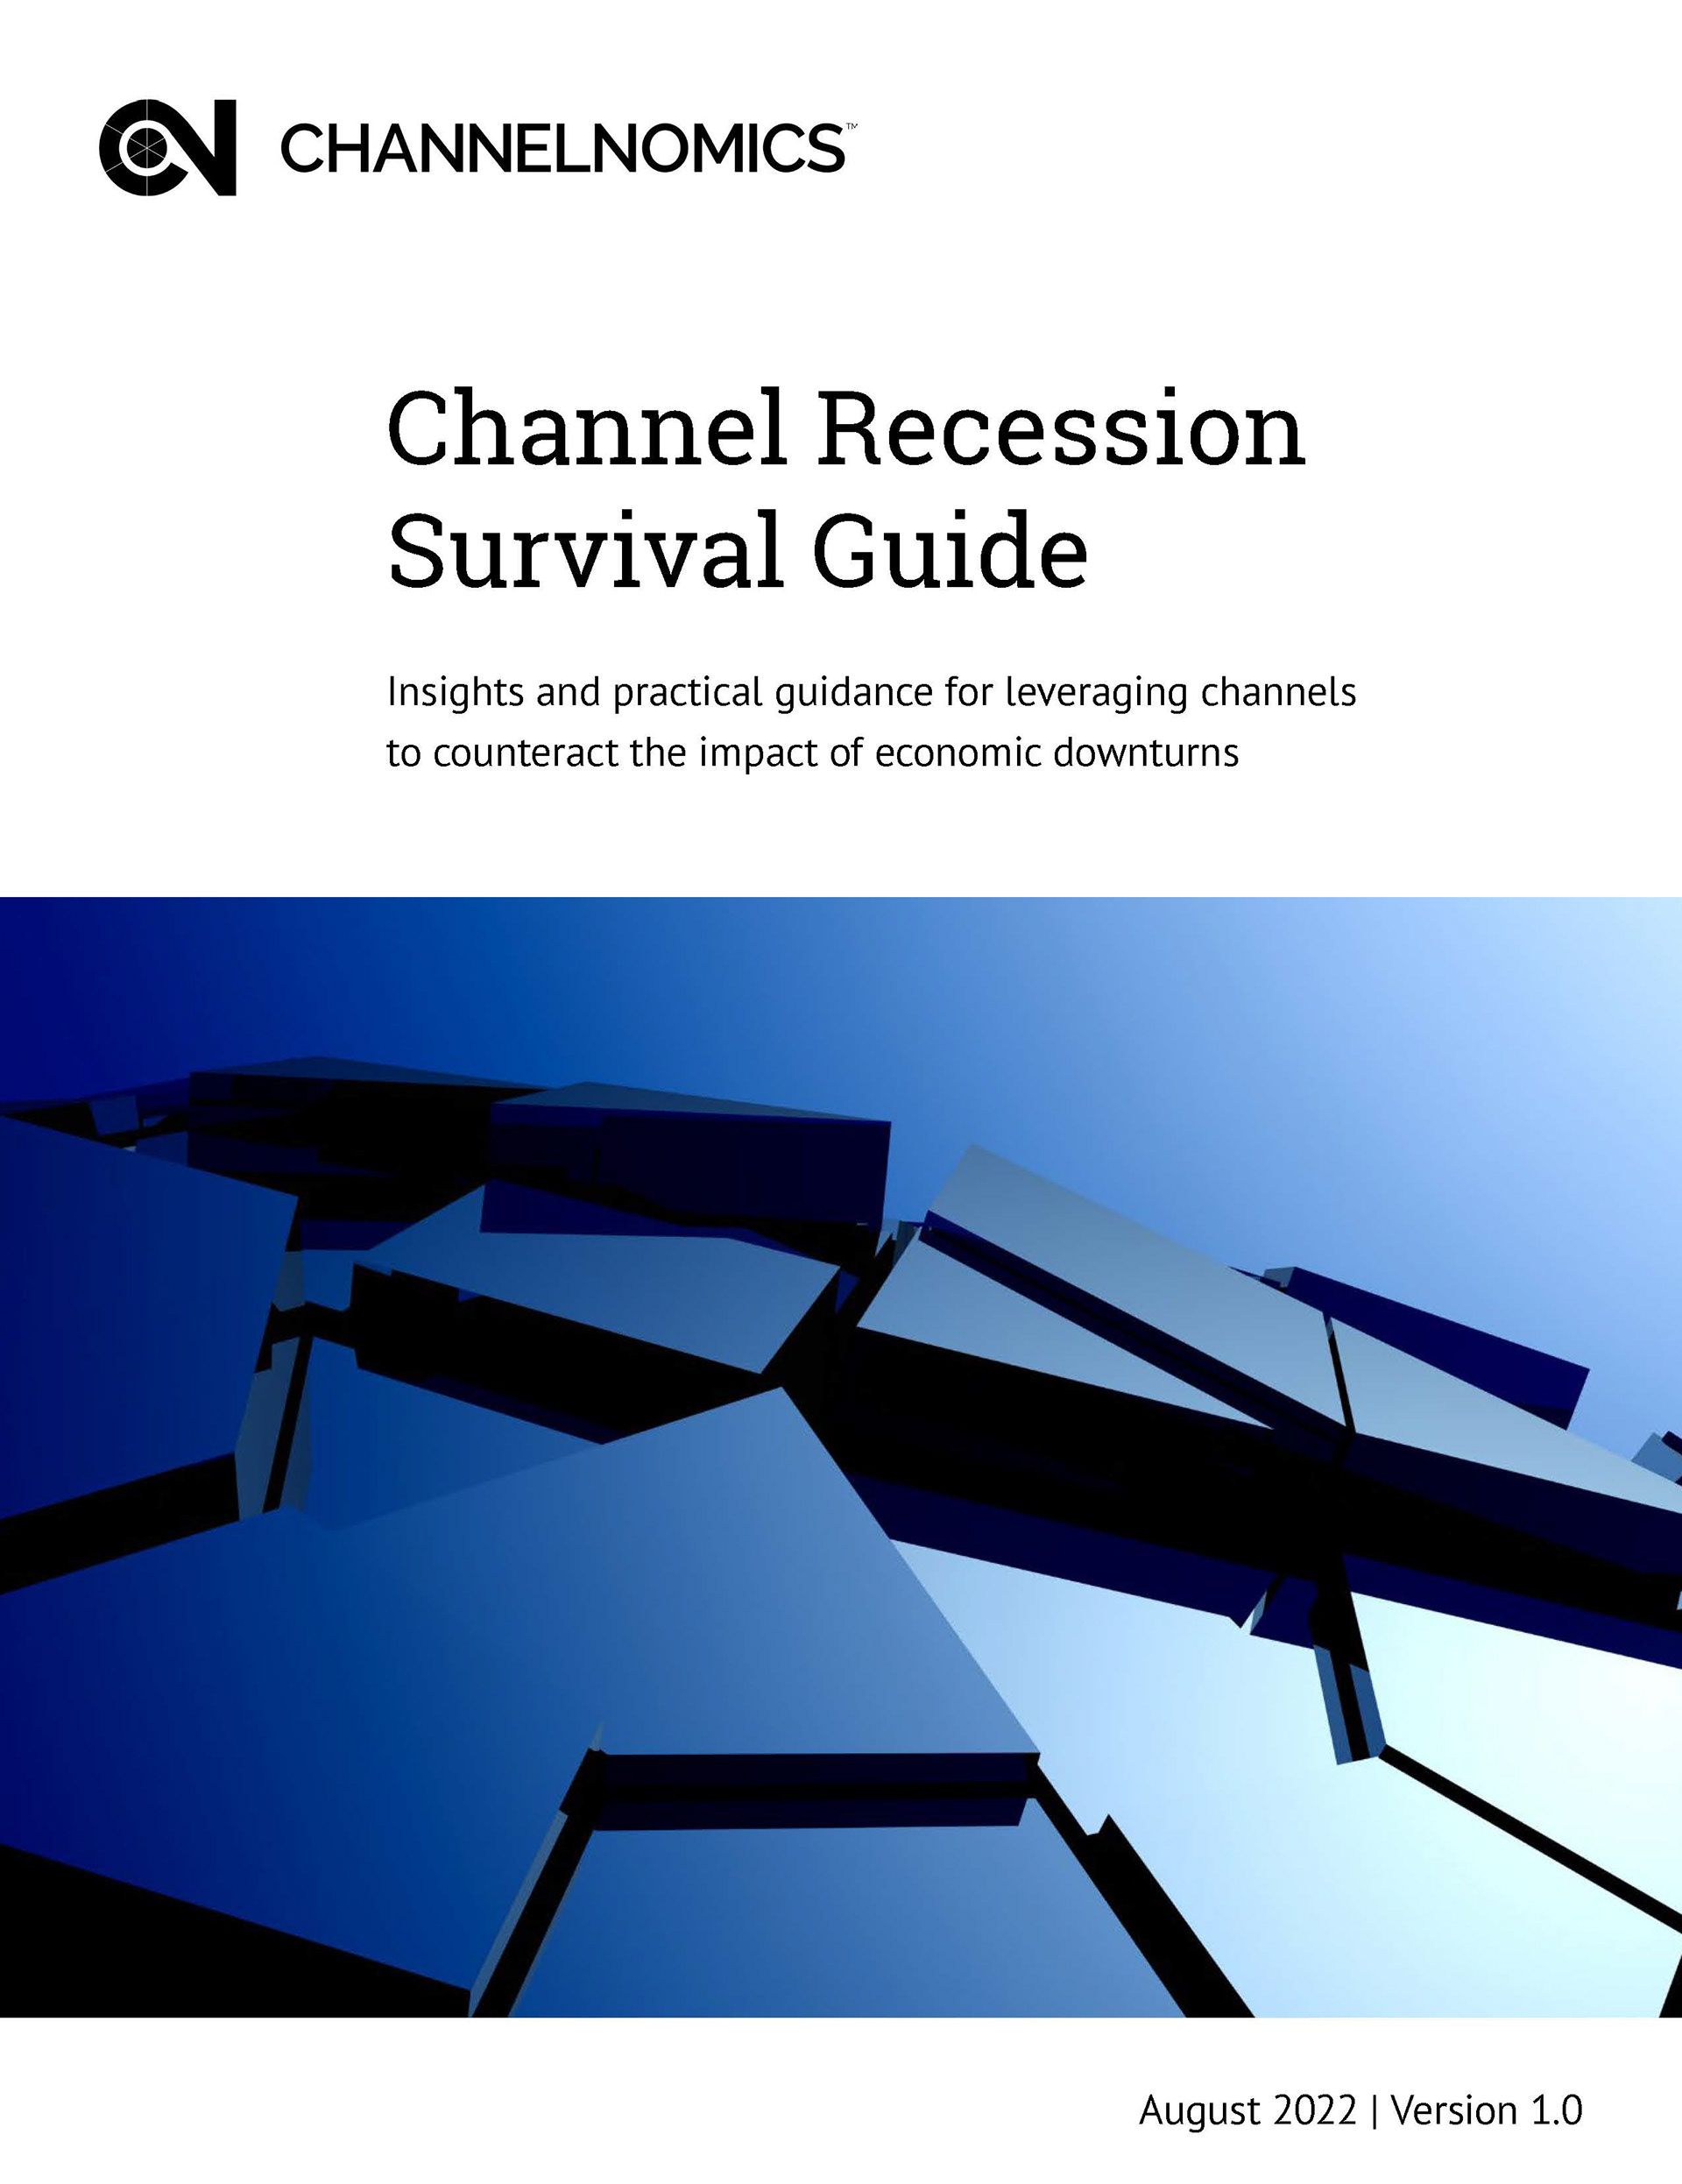
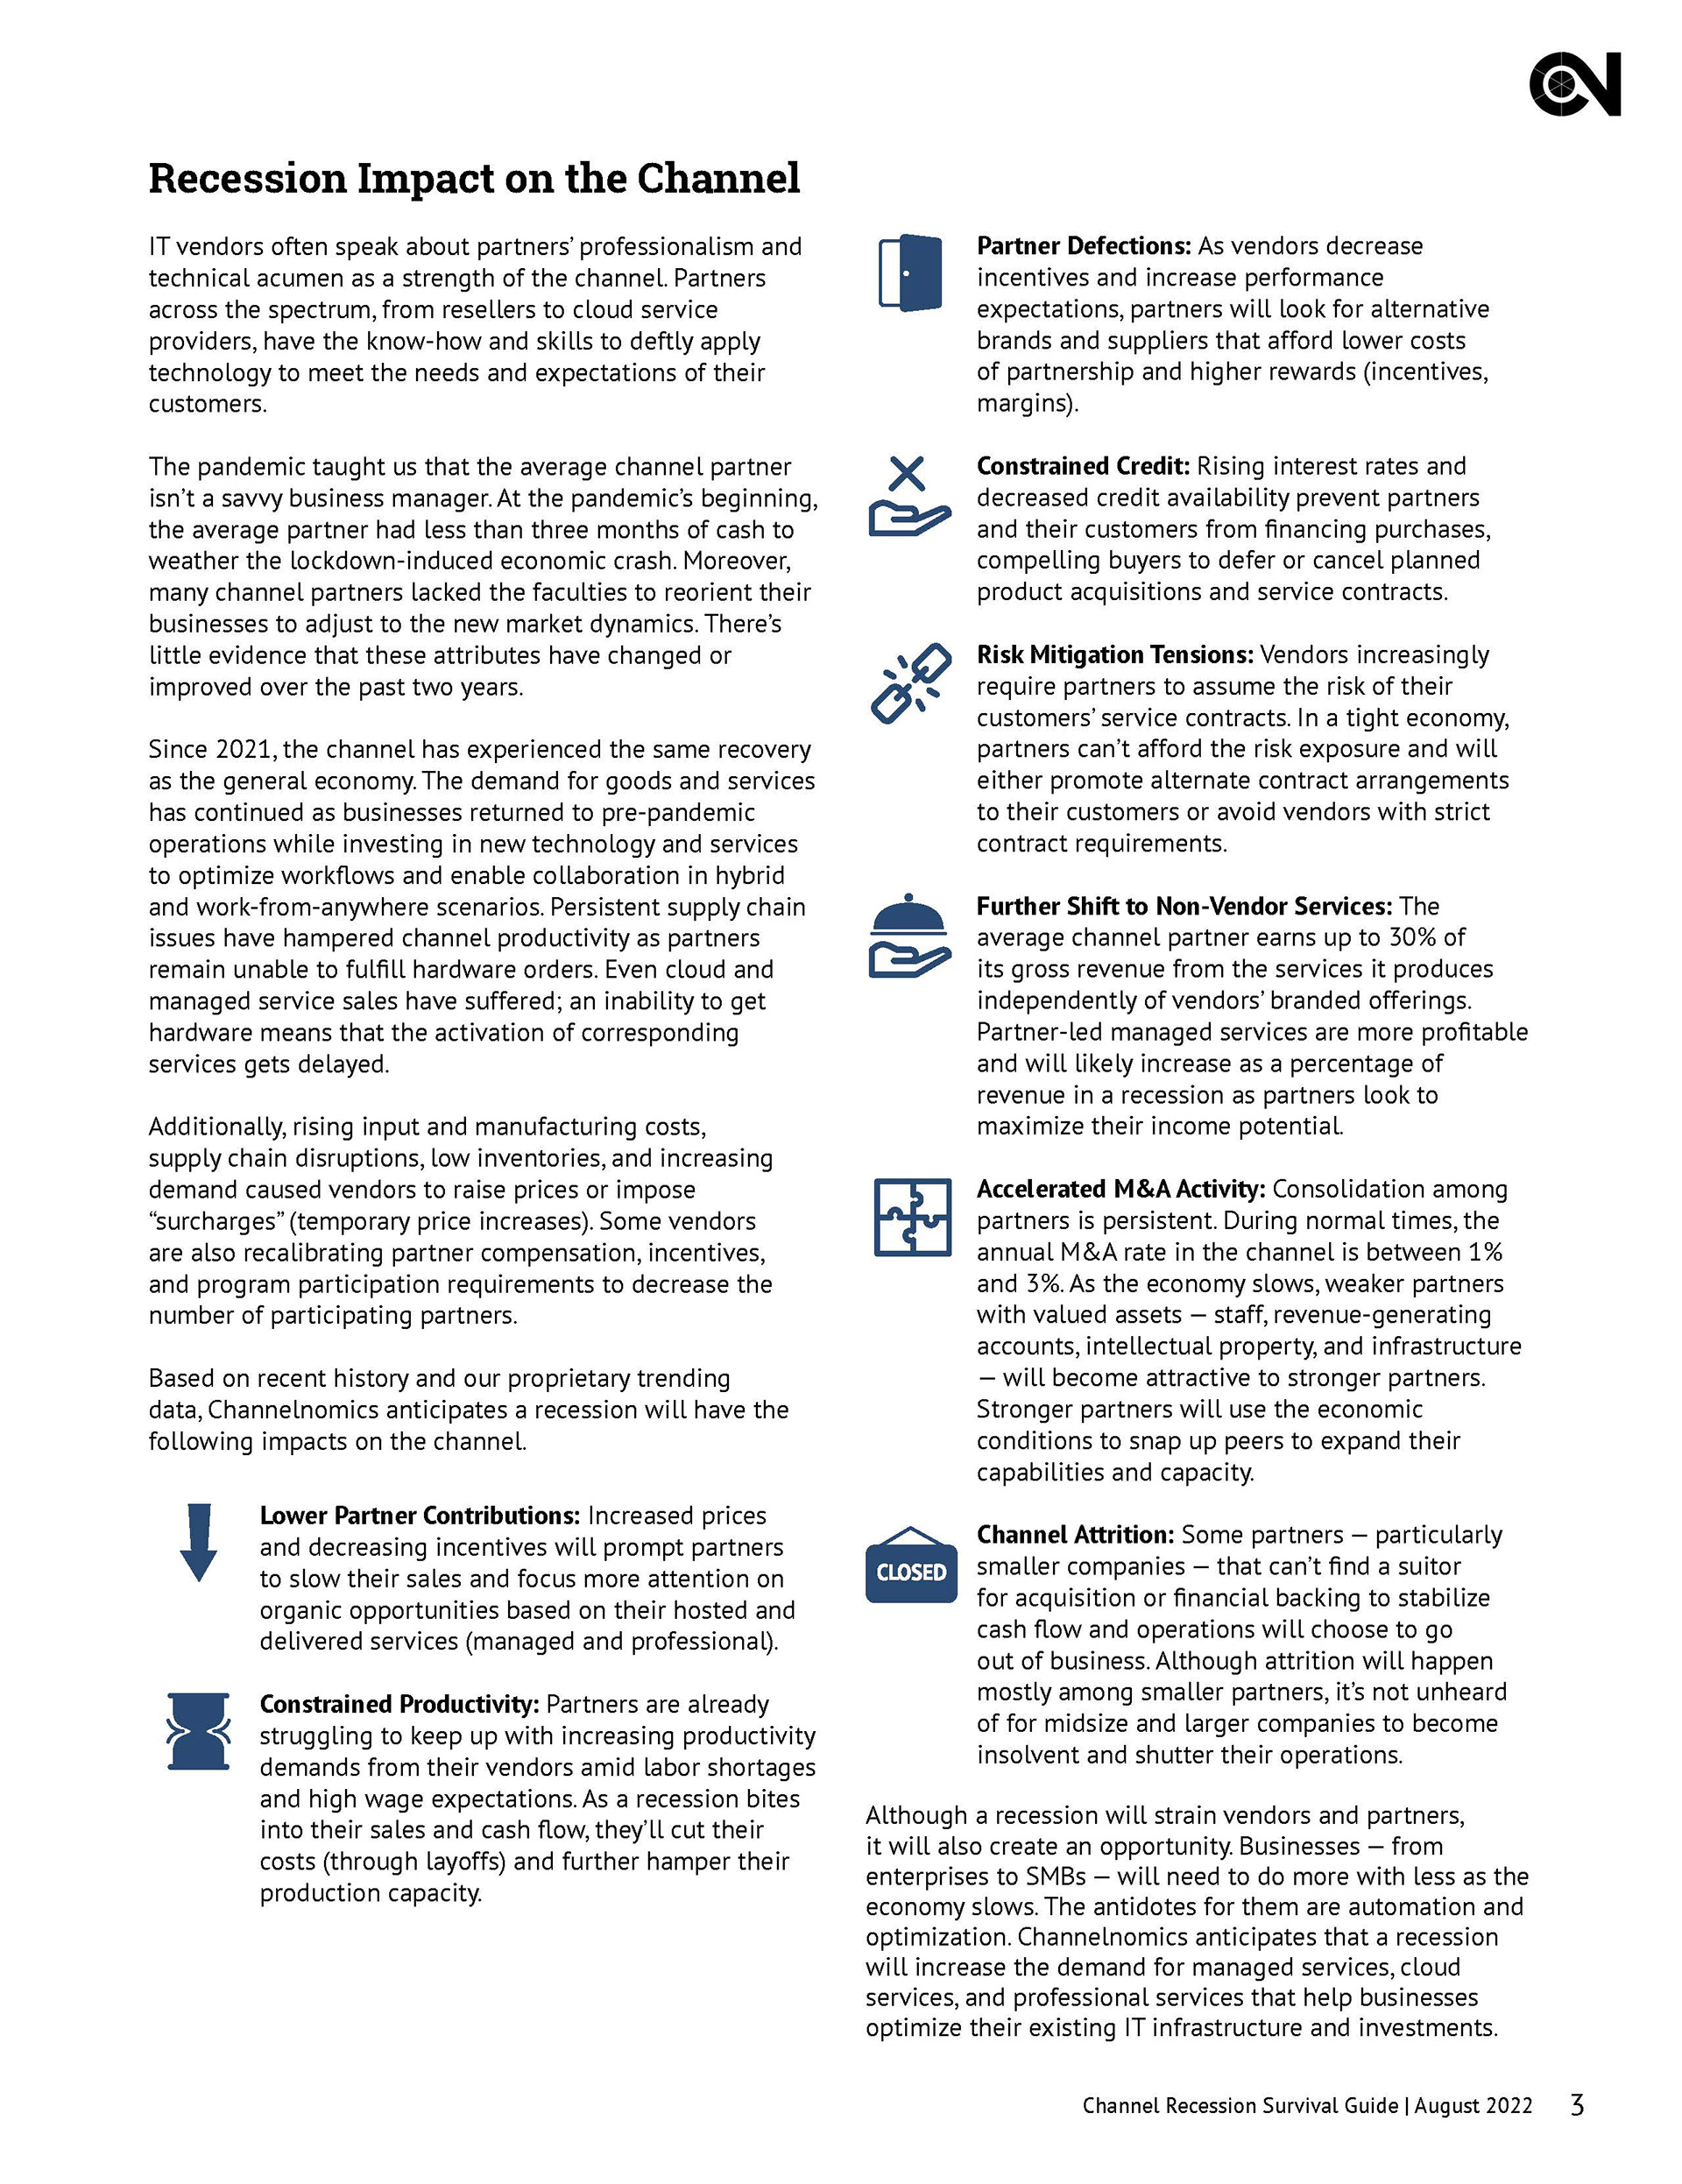
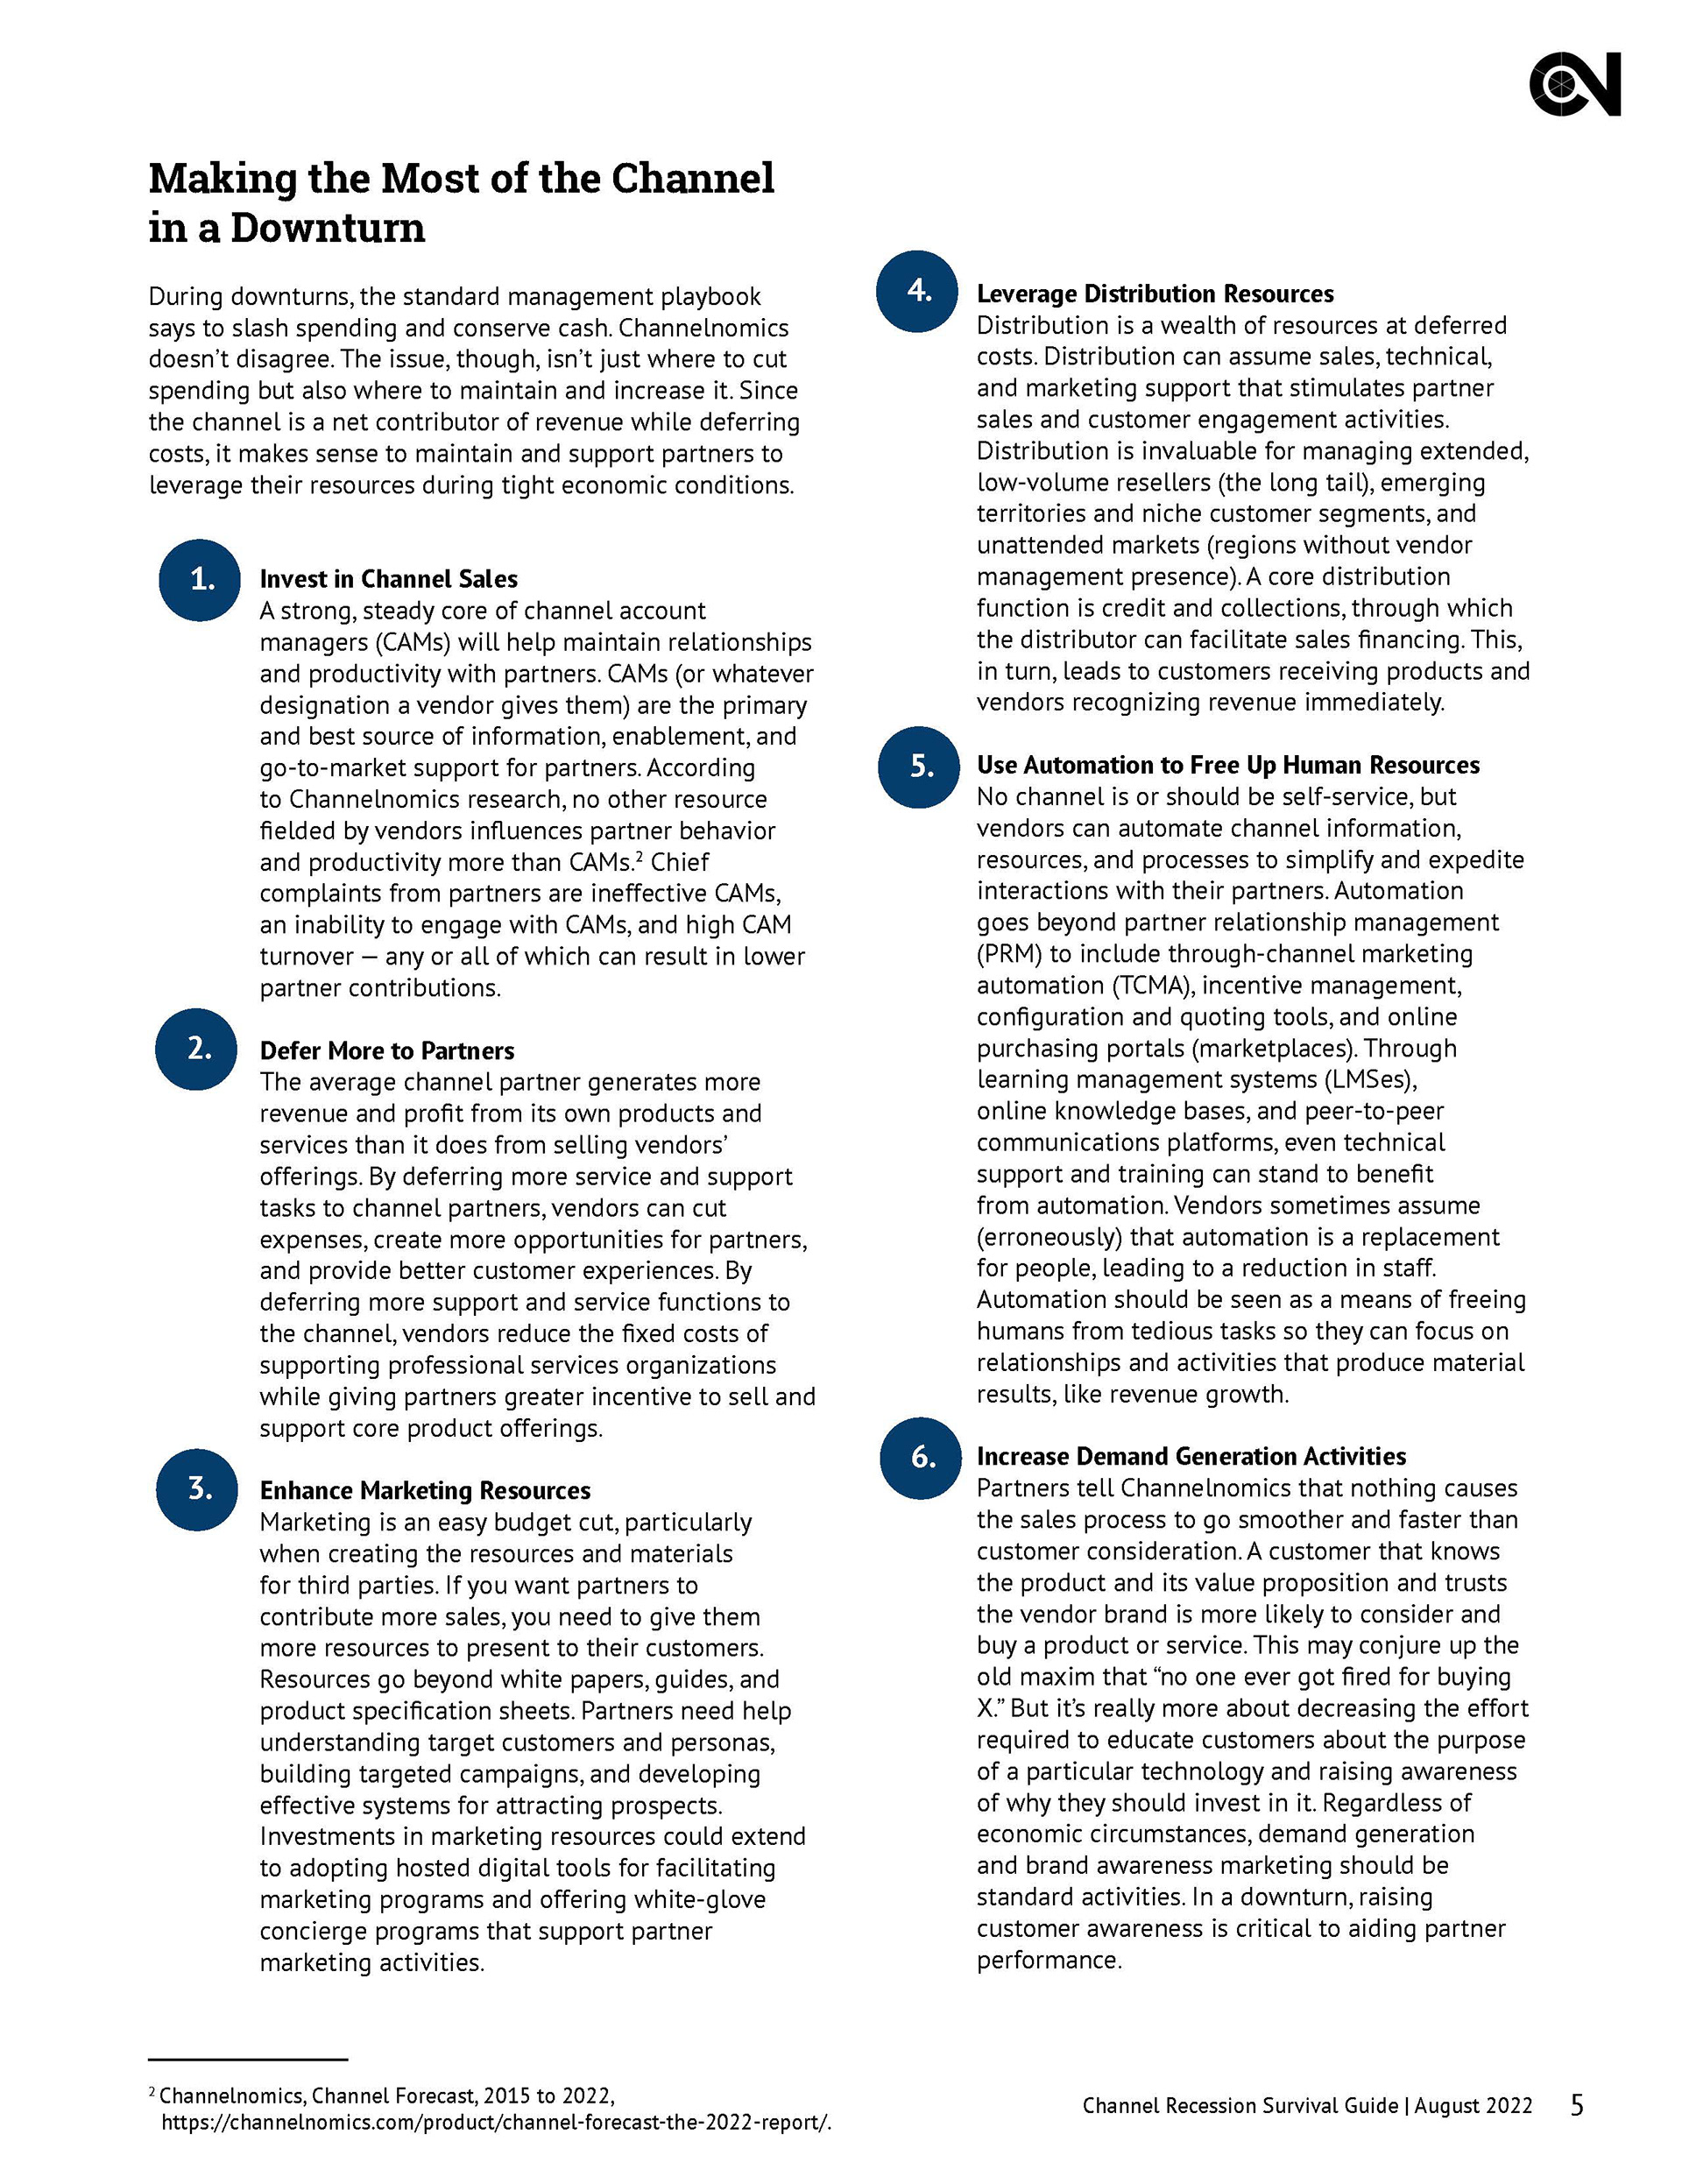
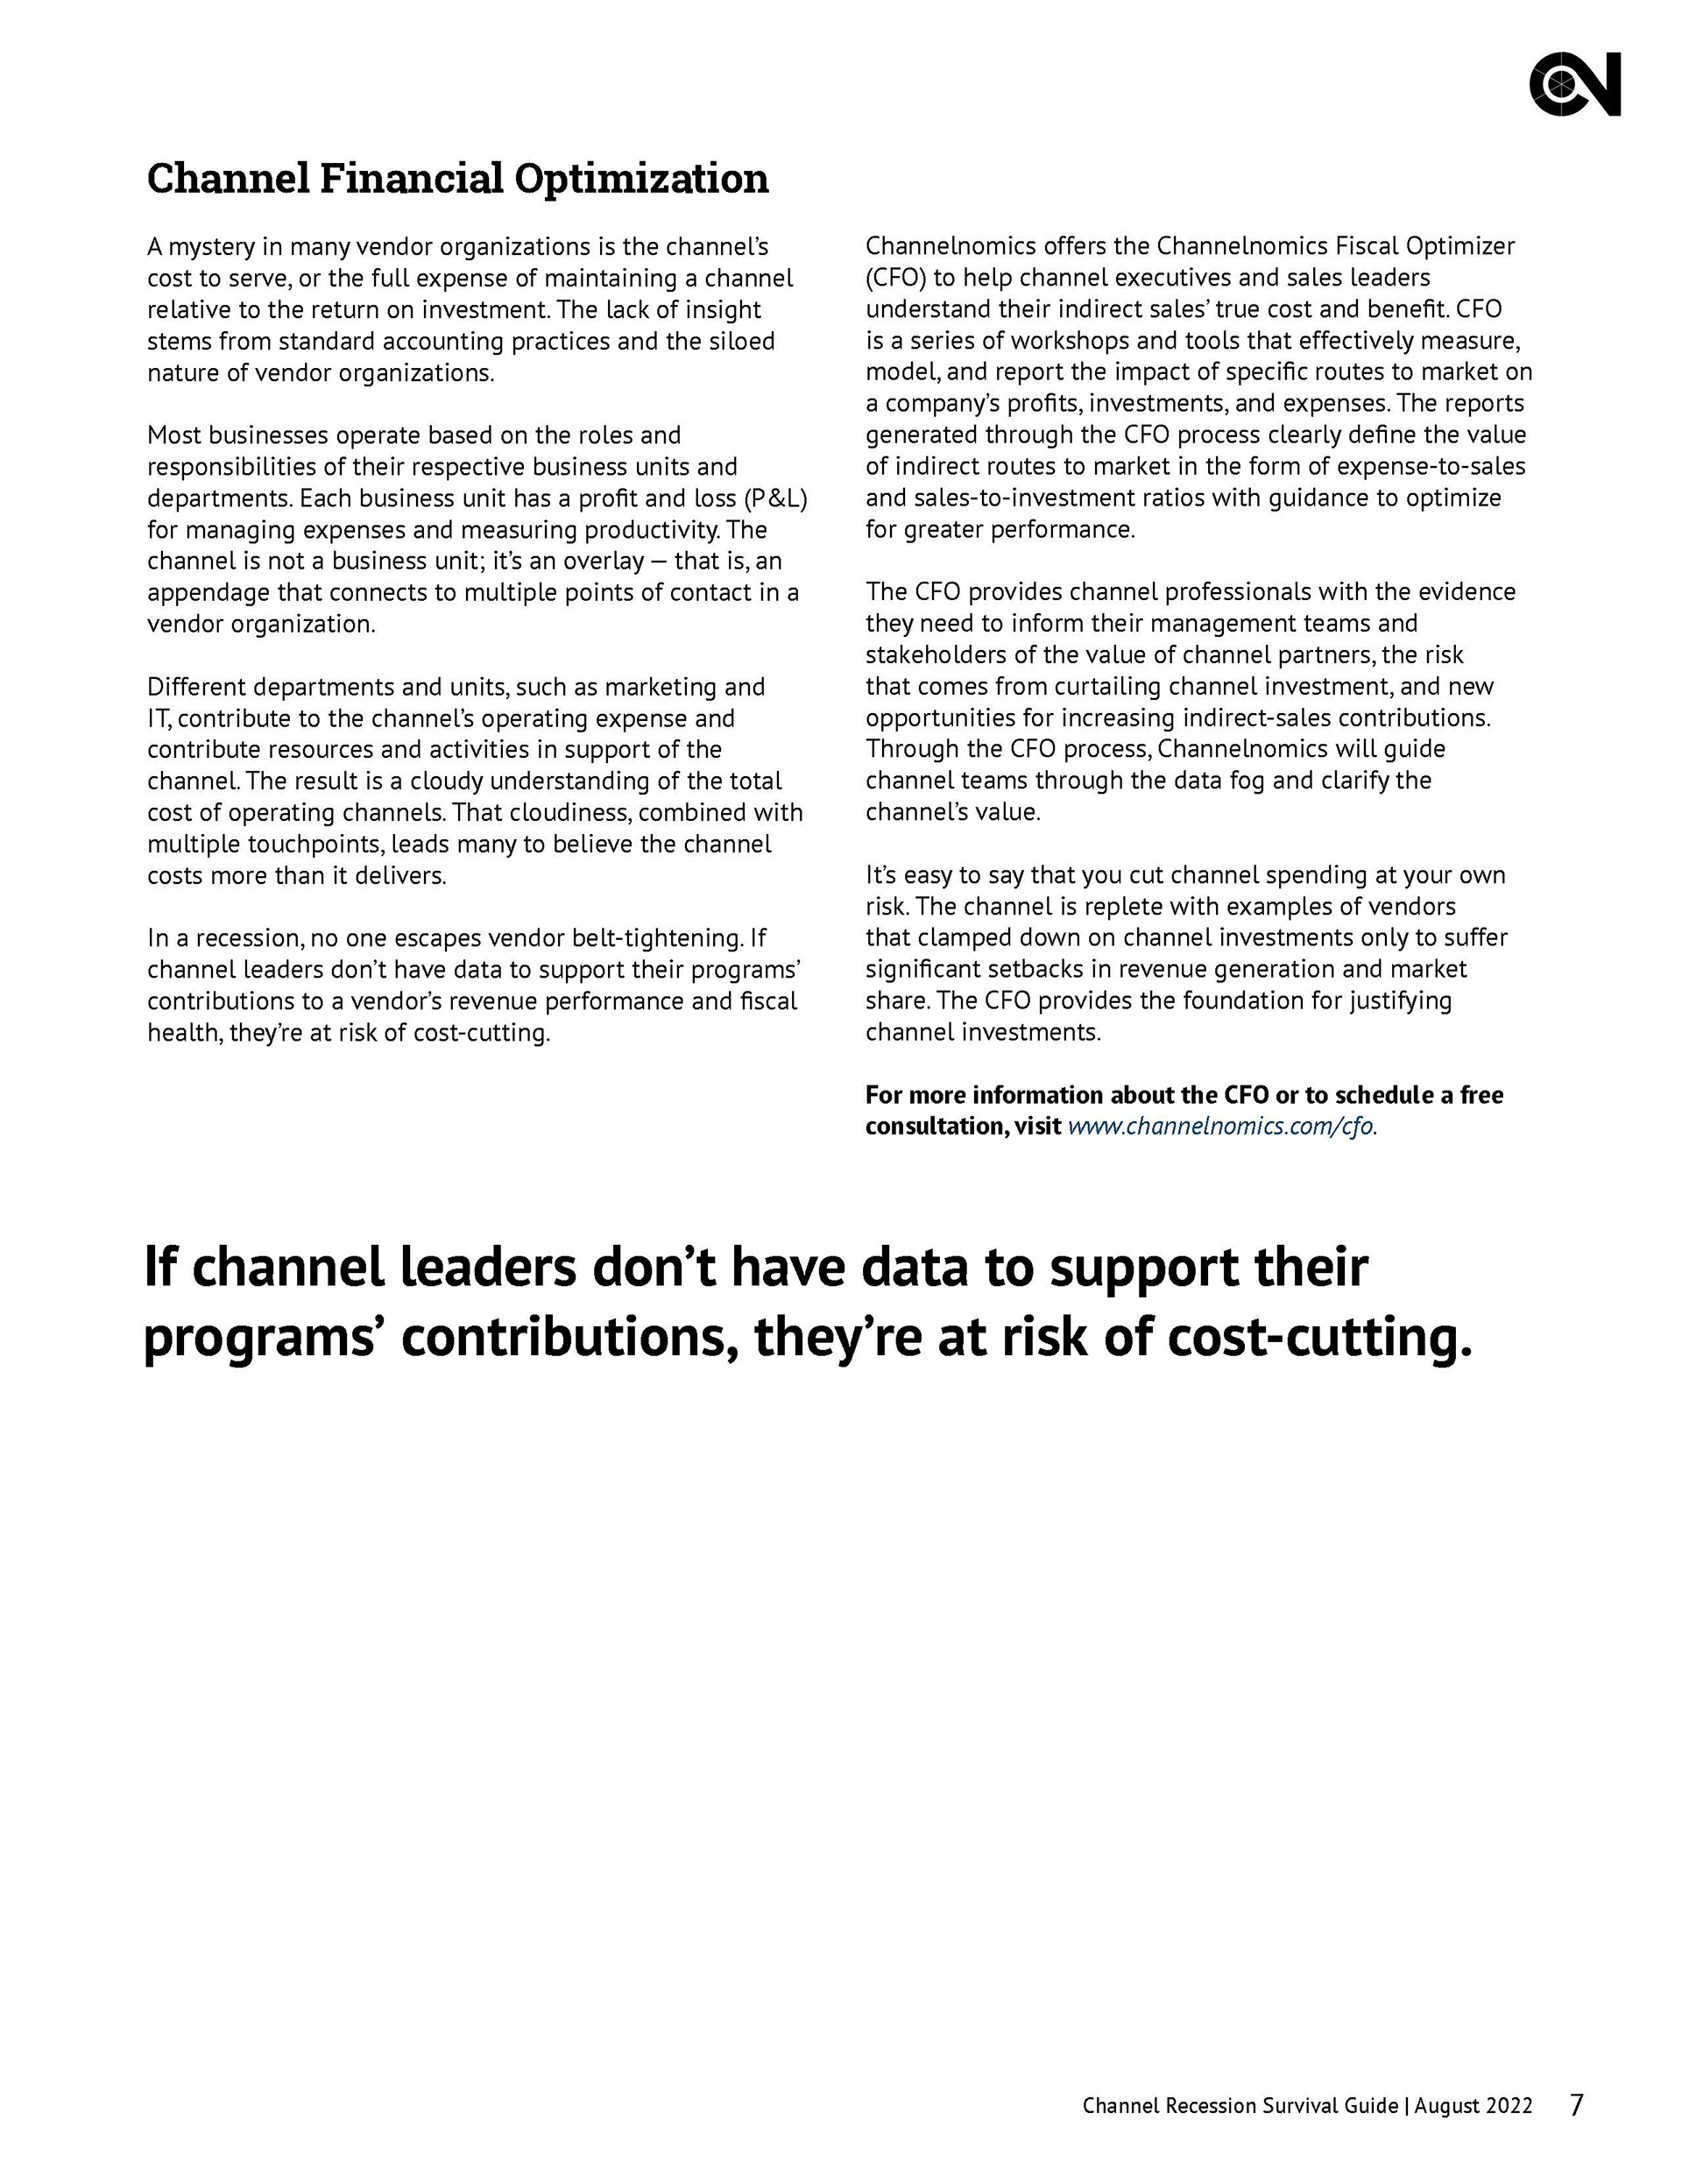
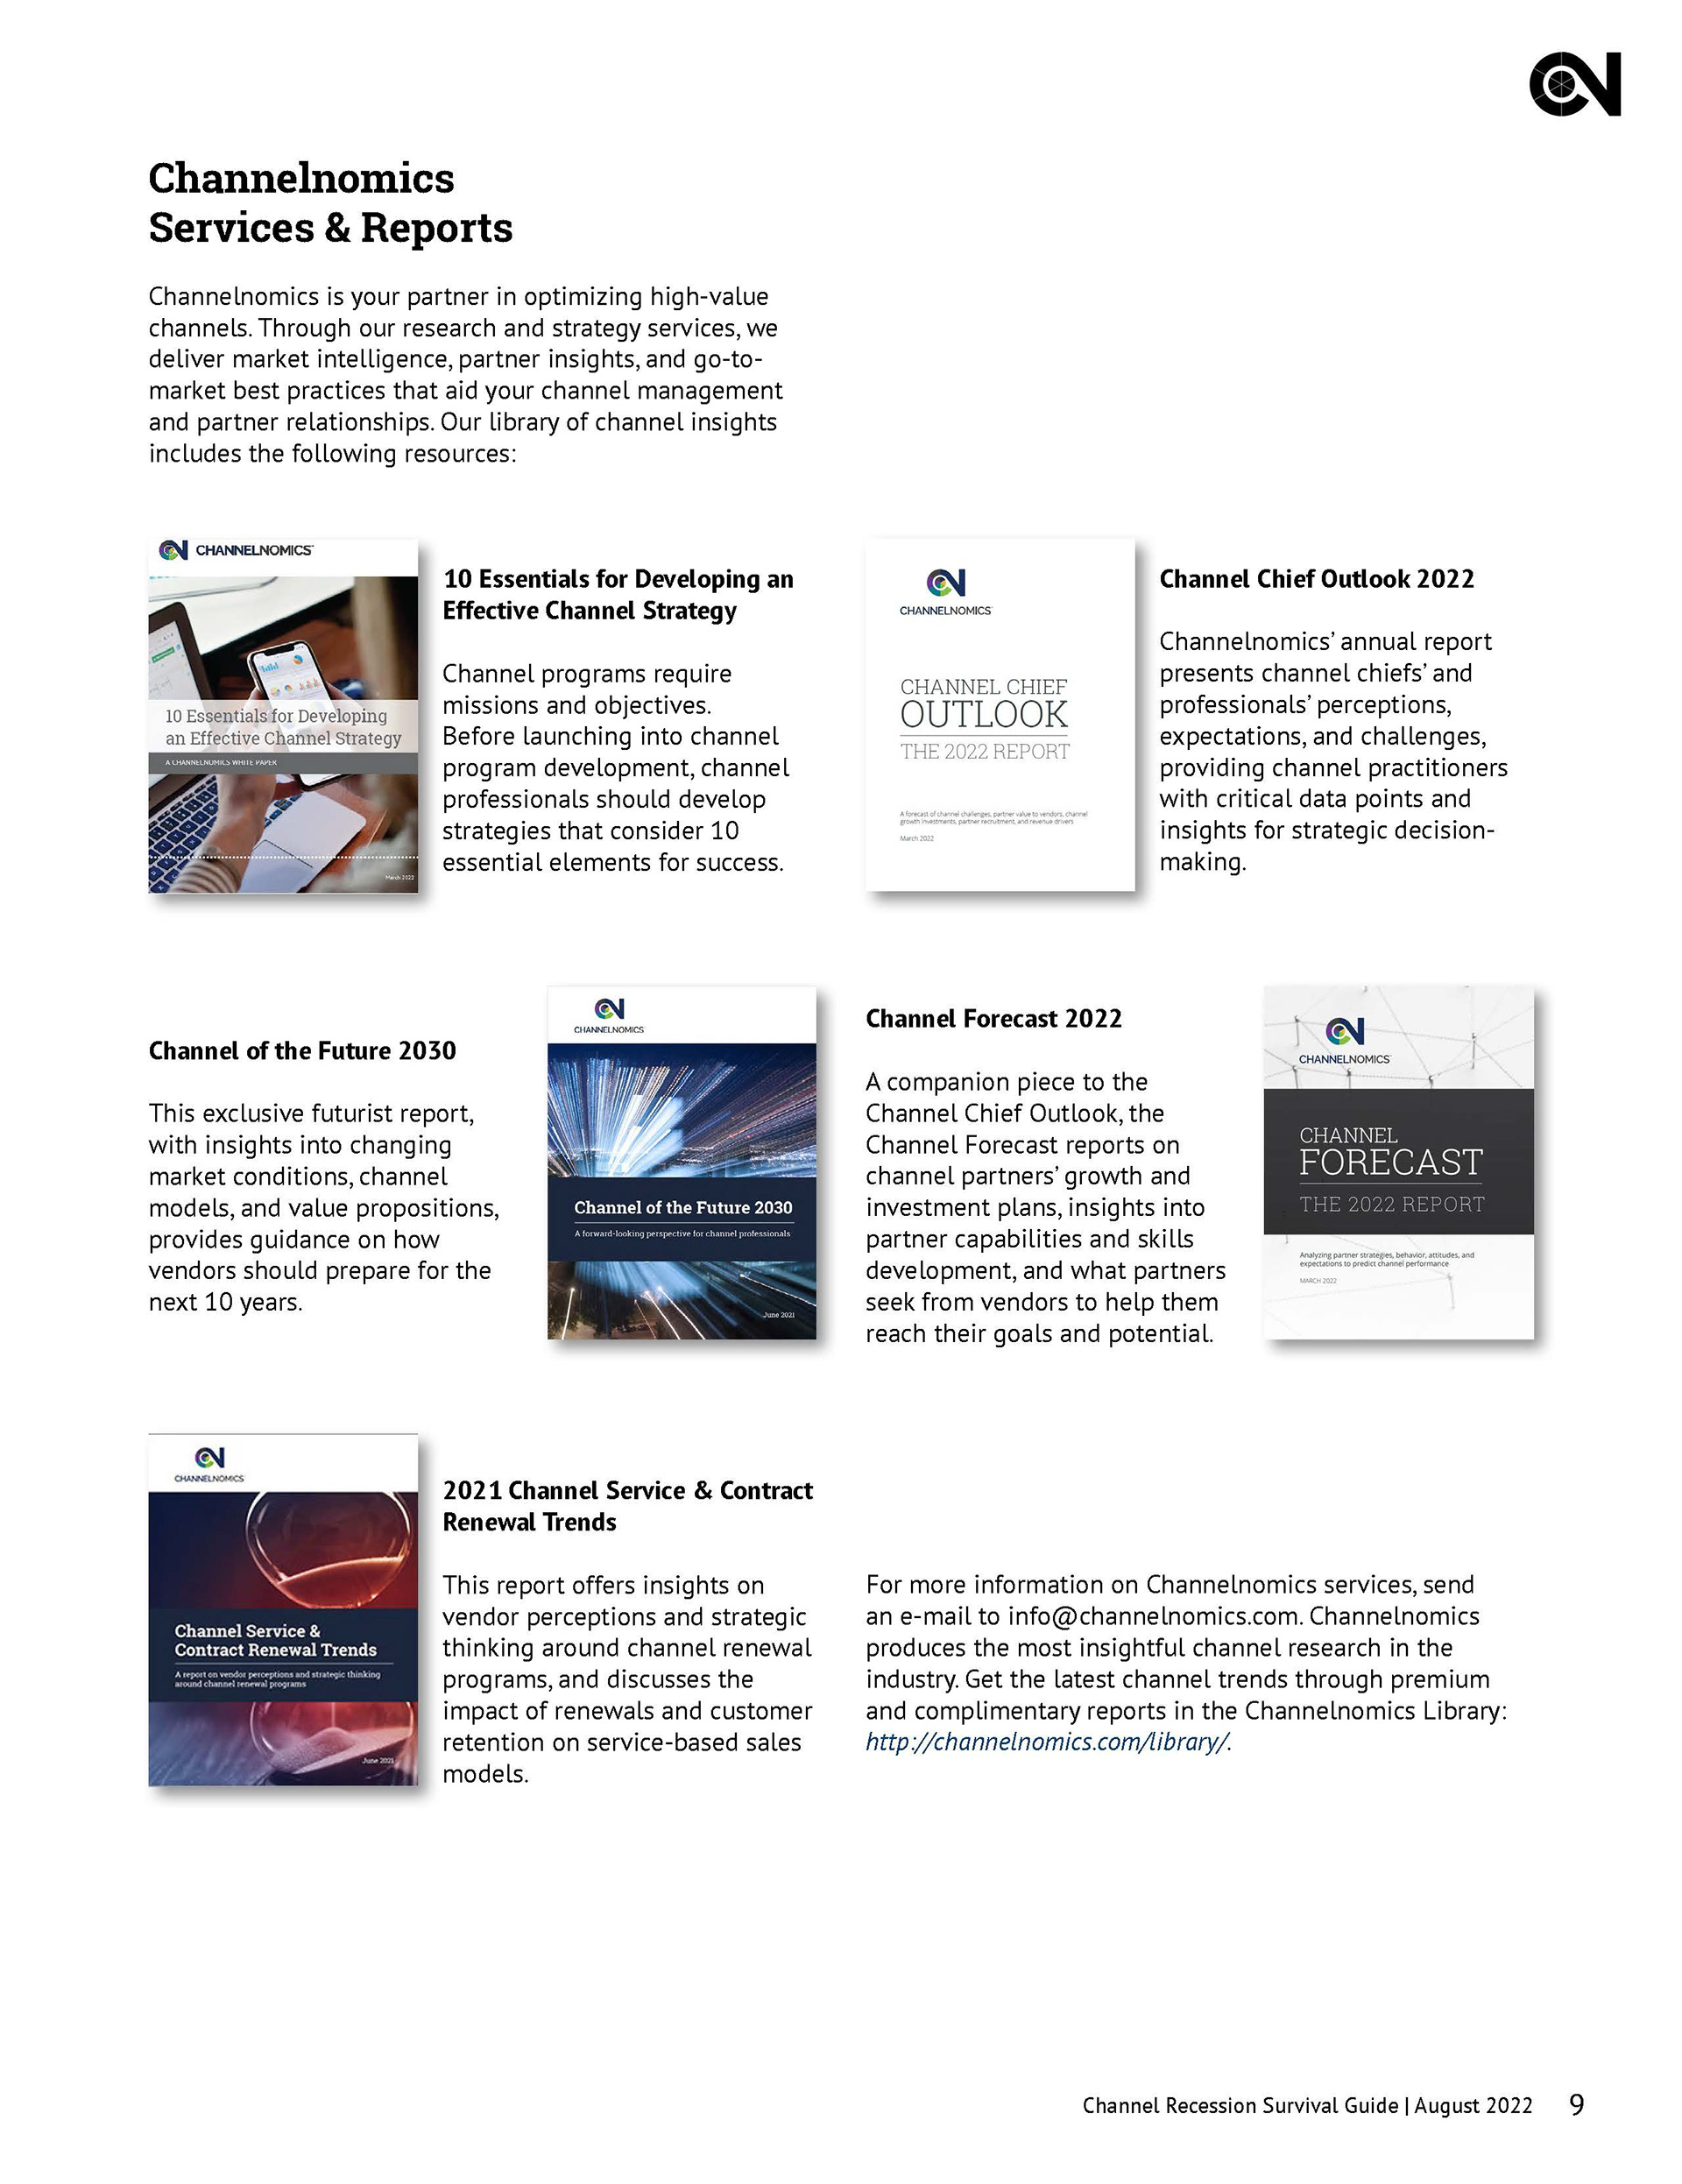
These reports were written to or on the behalf of technology companies like Ingram, Google, Microsoft, etc. After being given the copy from the writing team, it was my job to create an attractive cover and a clean layout for the information that highlighted the major data points. I also took on the responsibility of defining their overall branding and ensuring that each client-facing product was consistent with that brand.

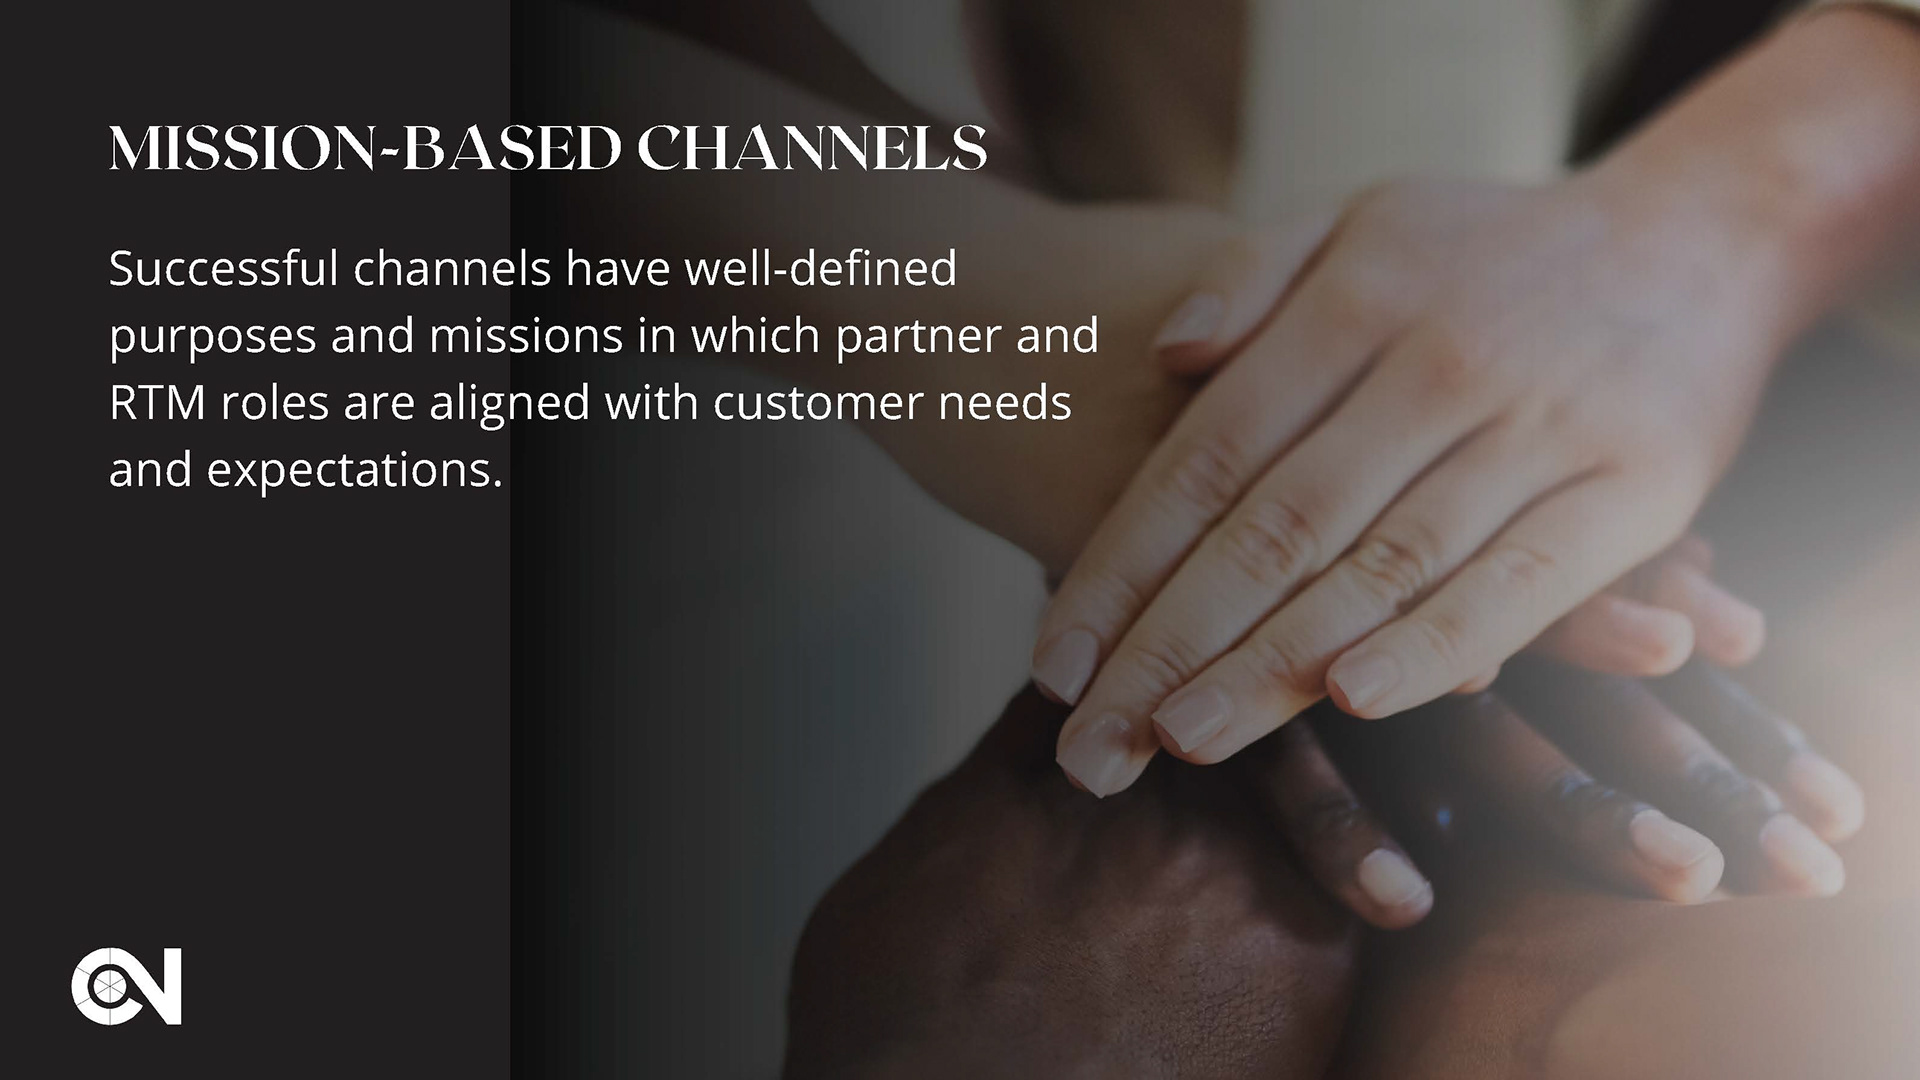
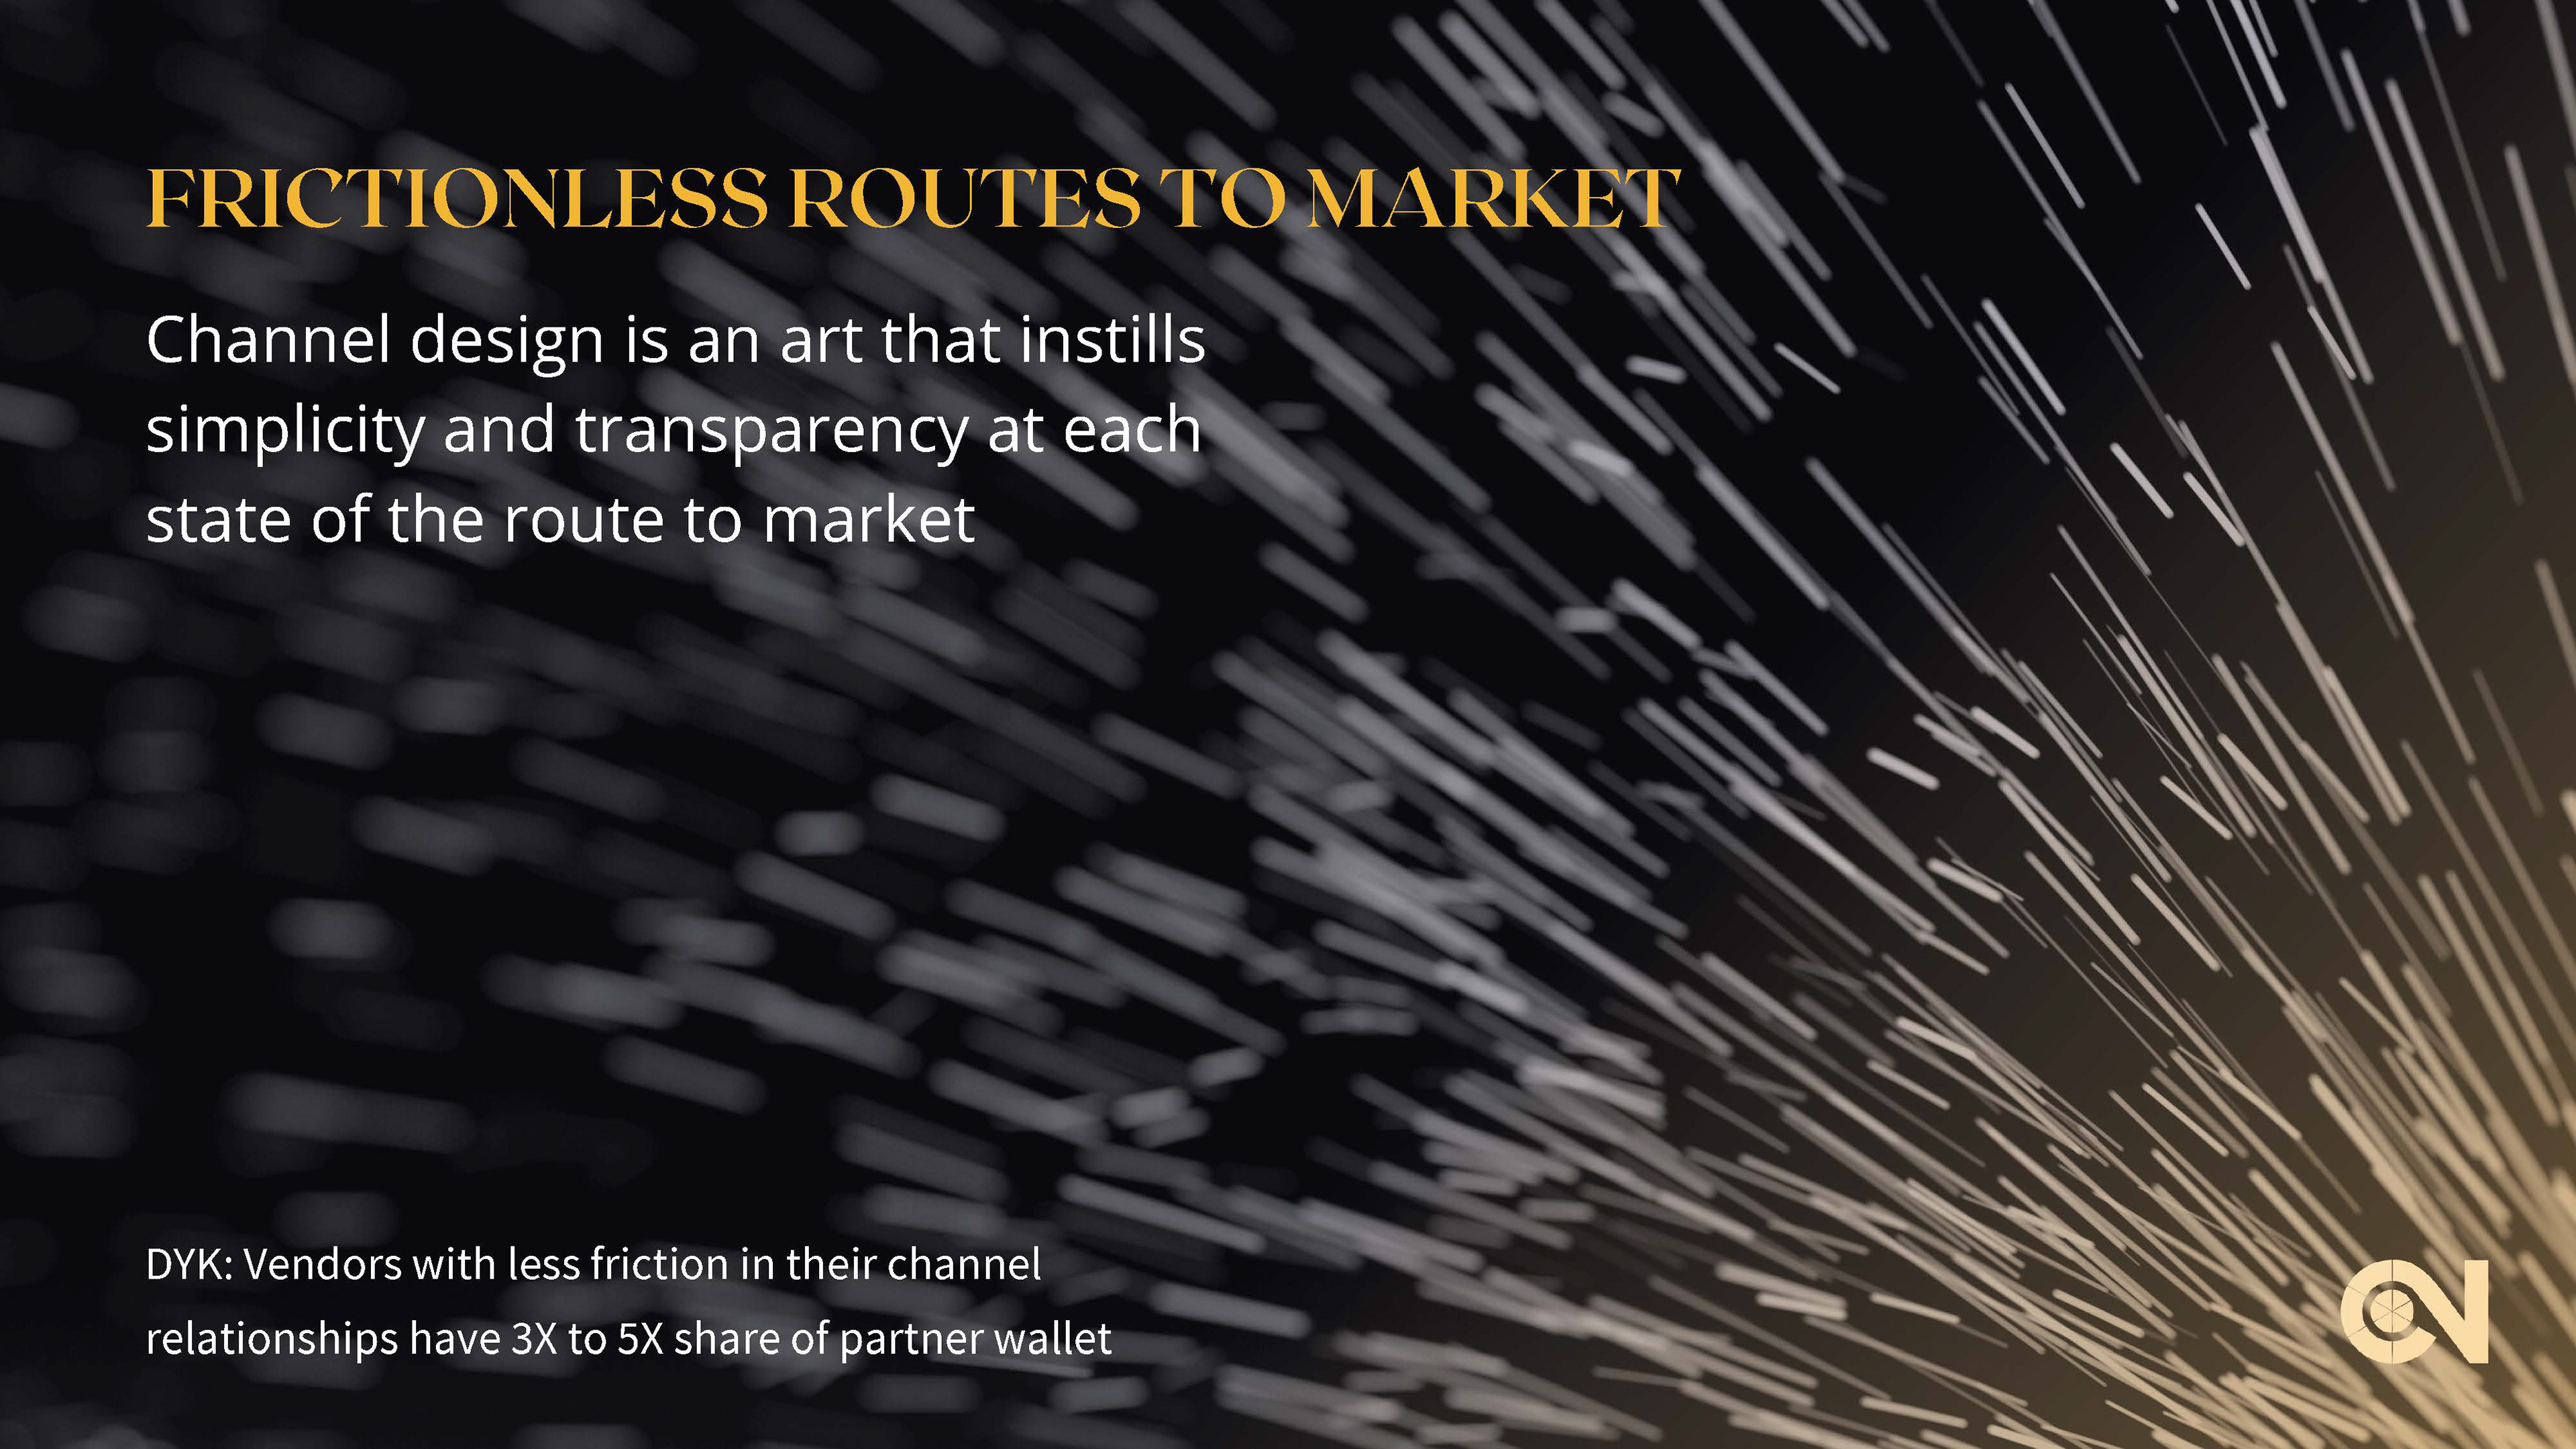
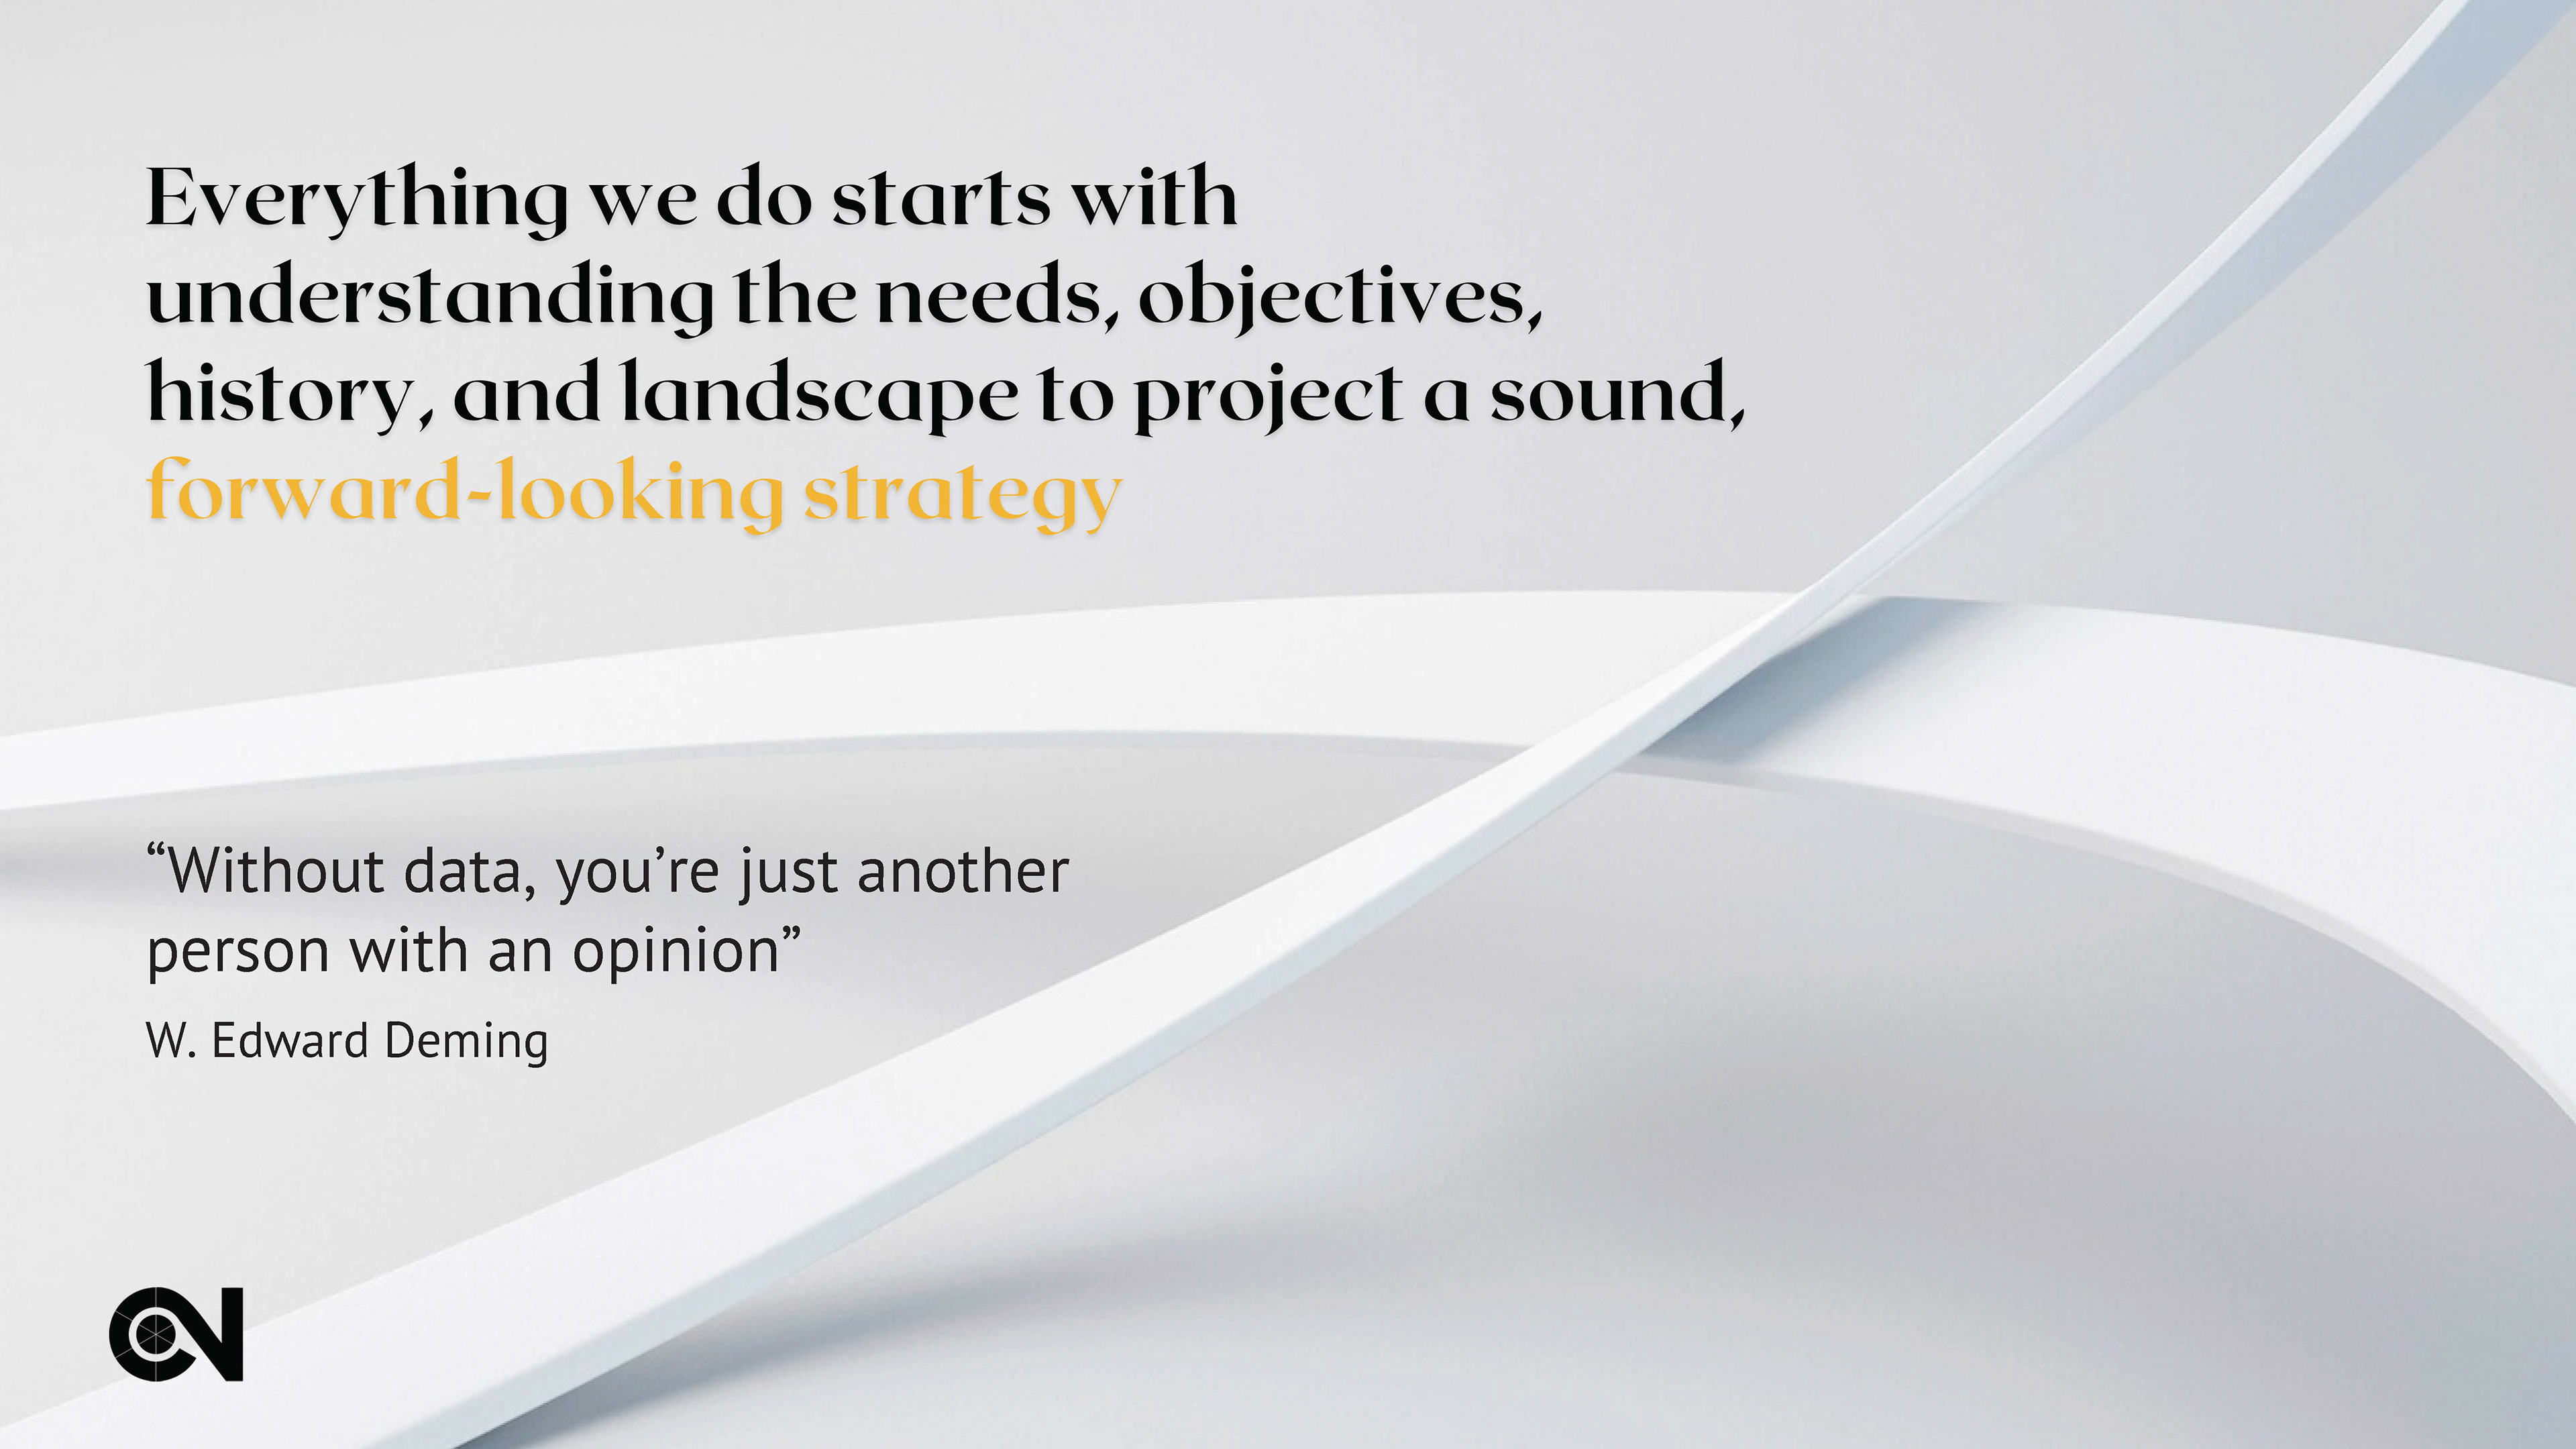
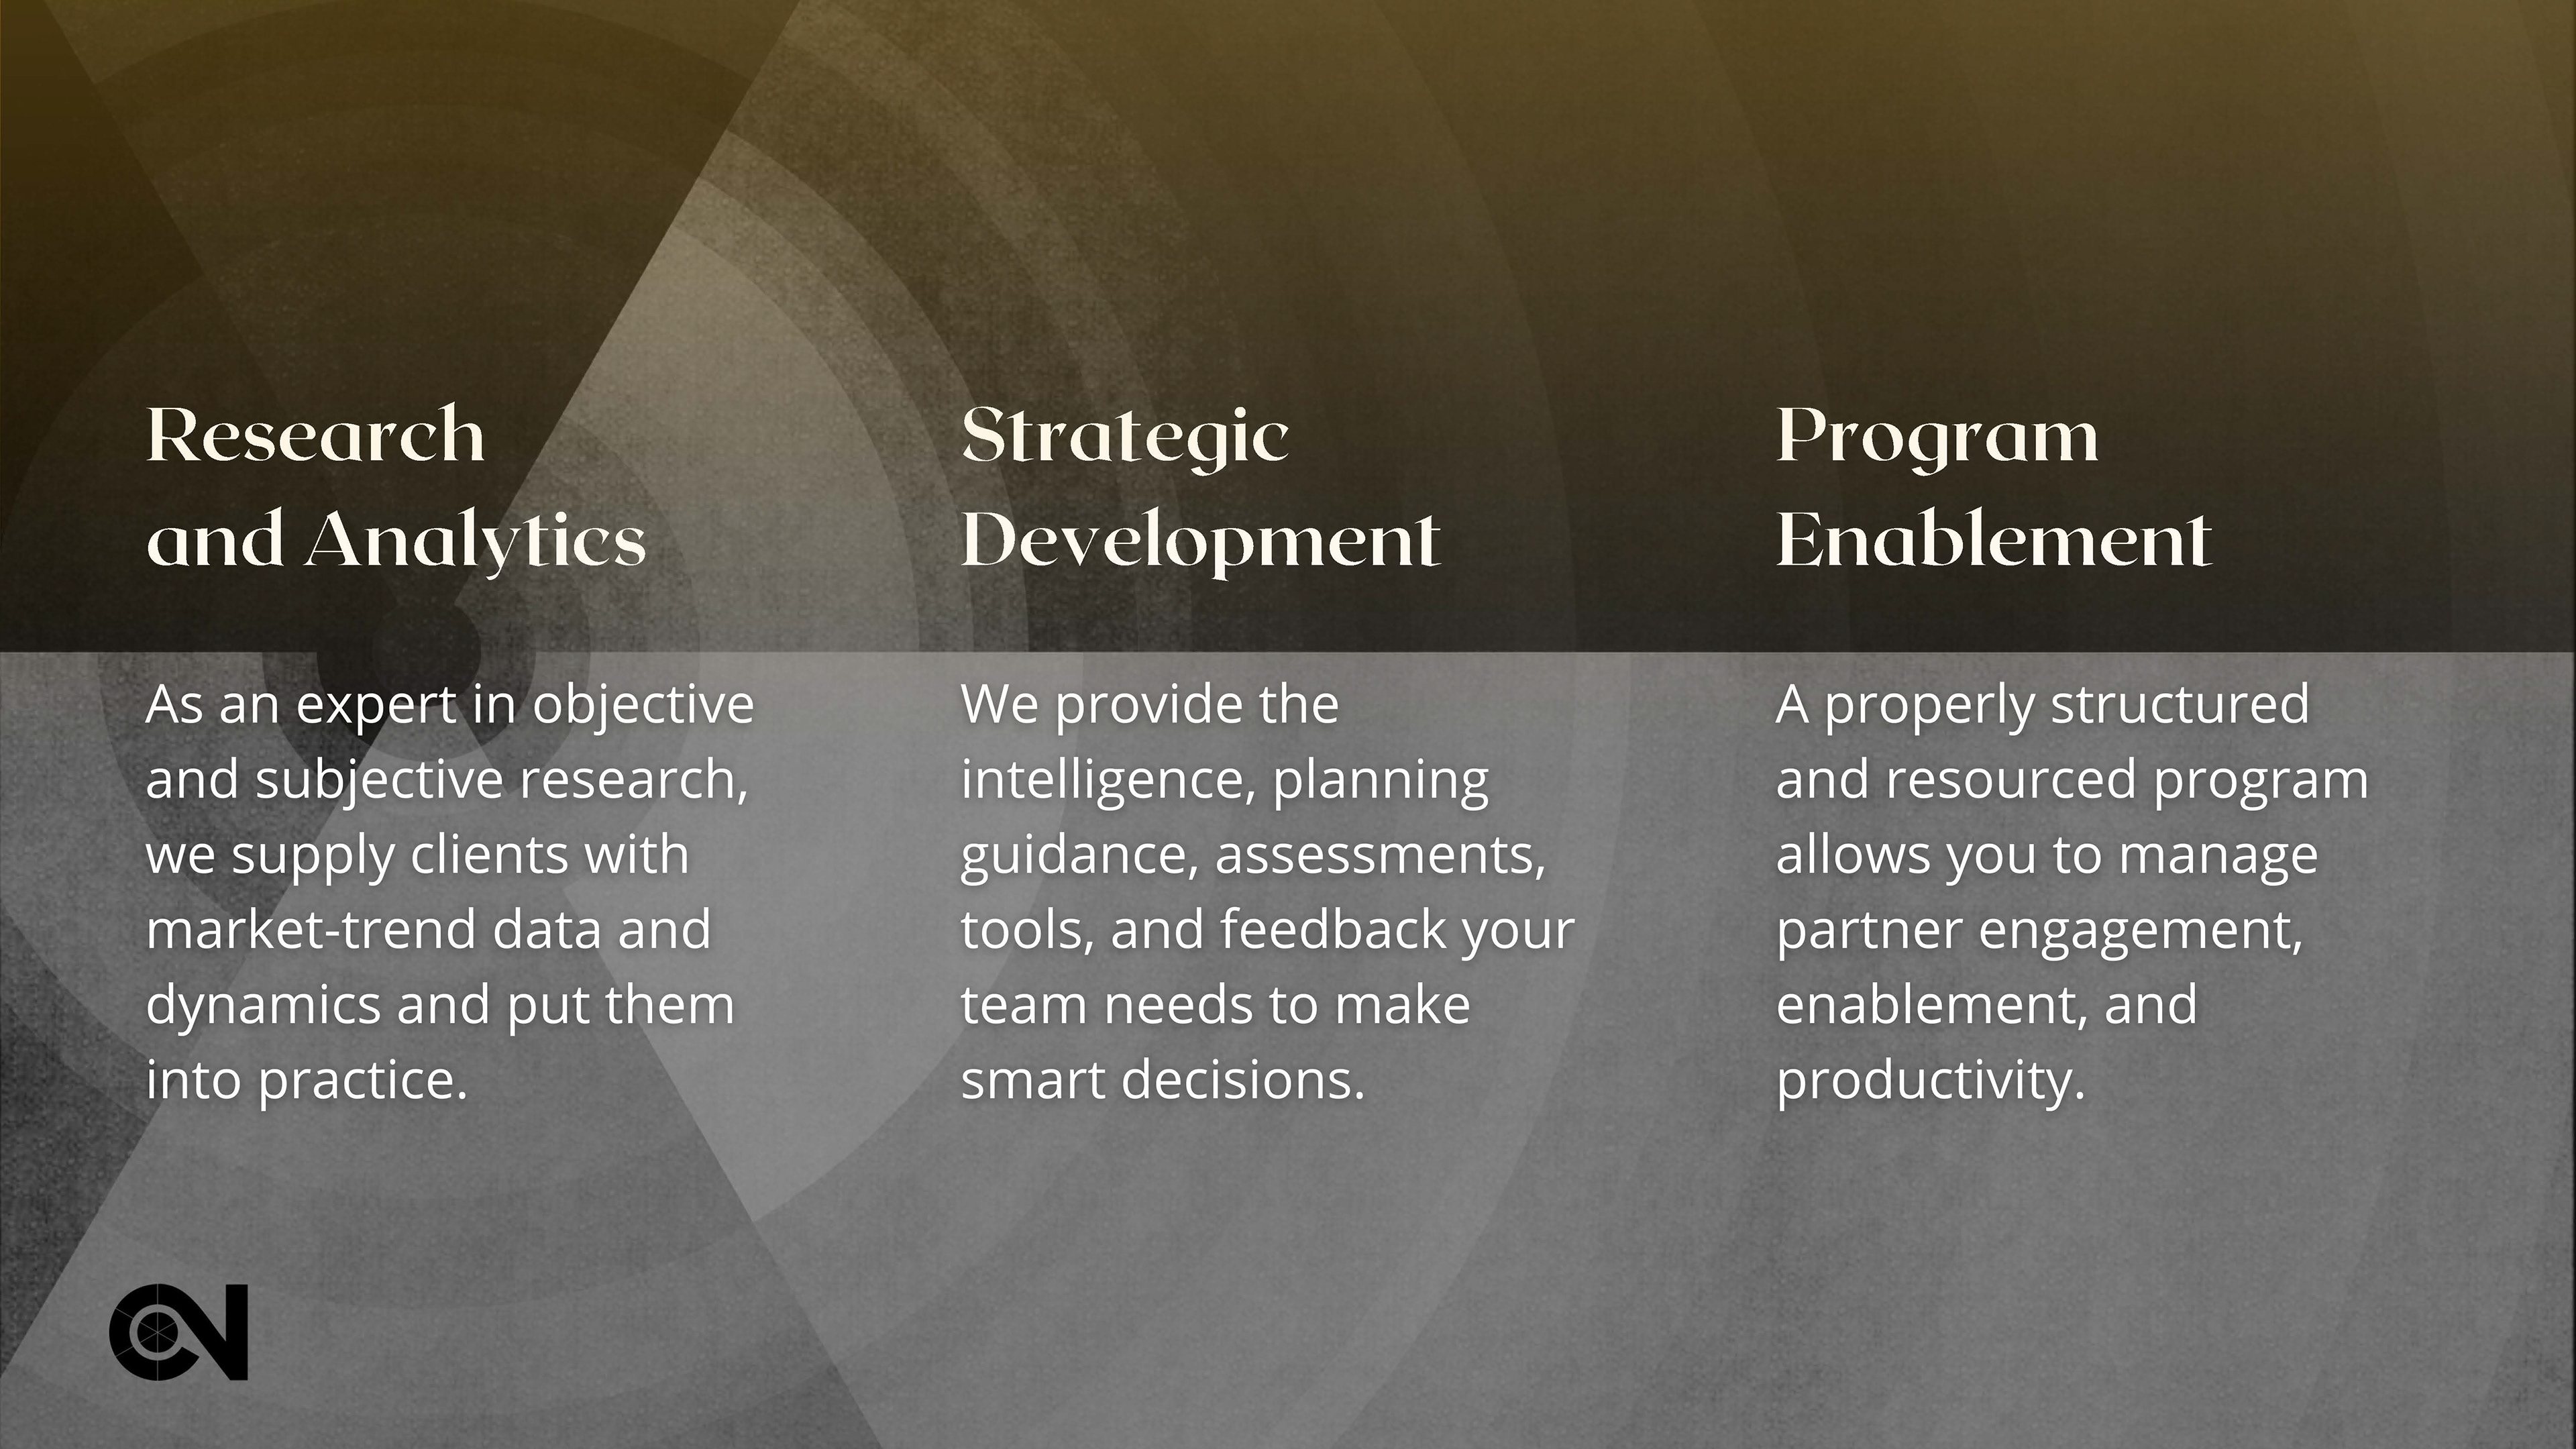
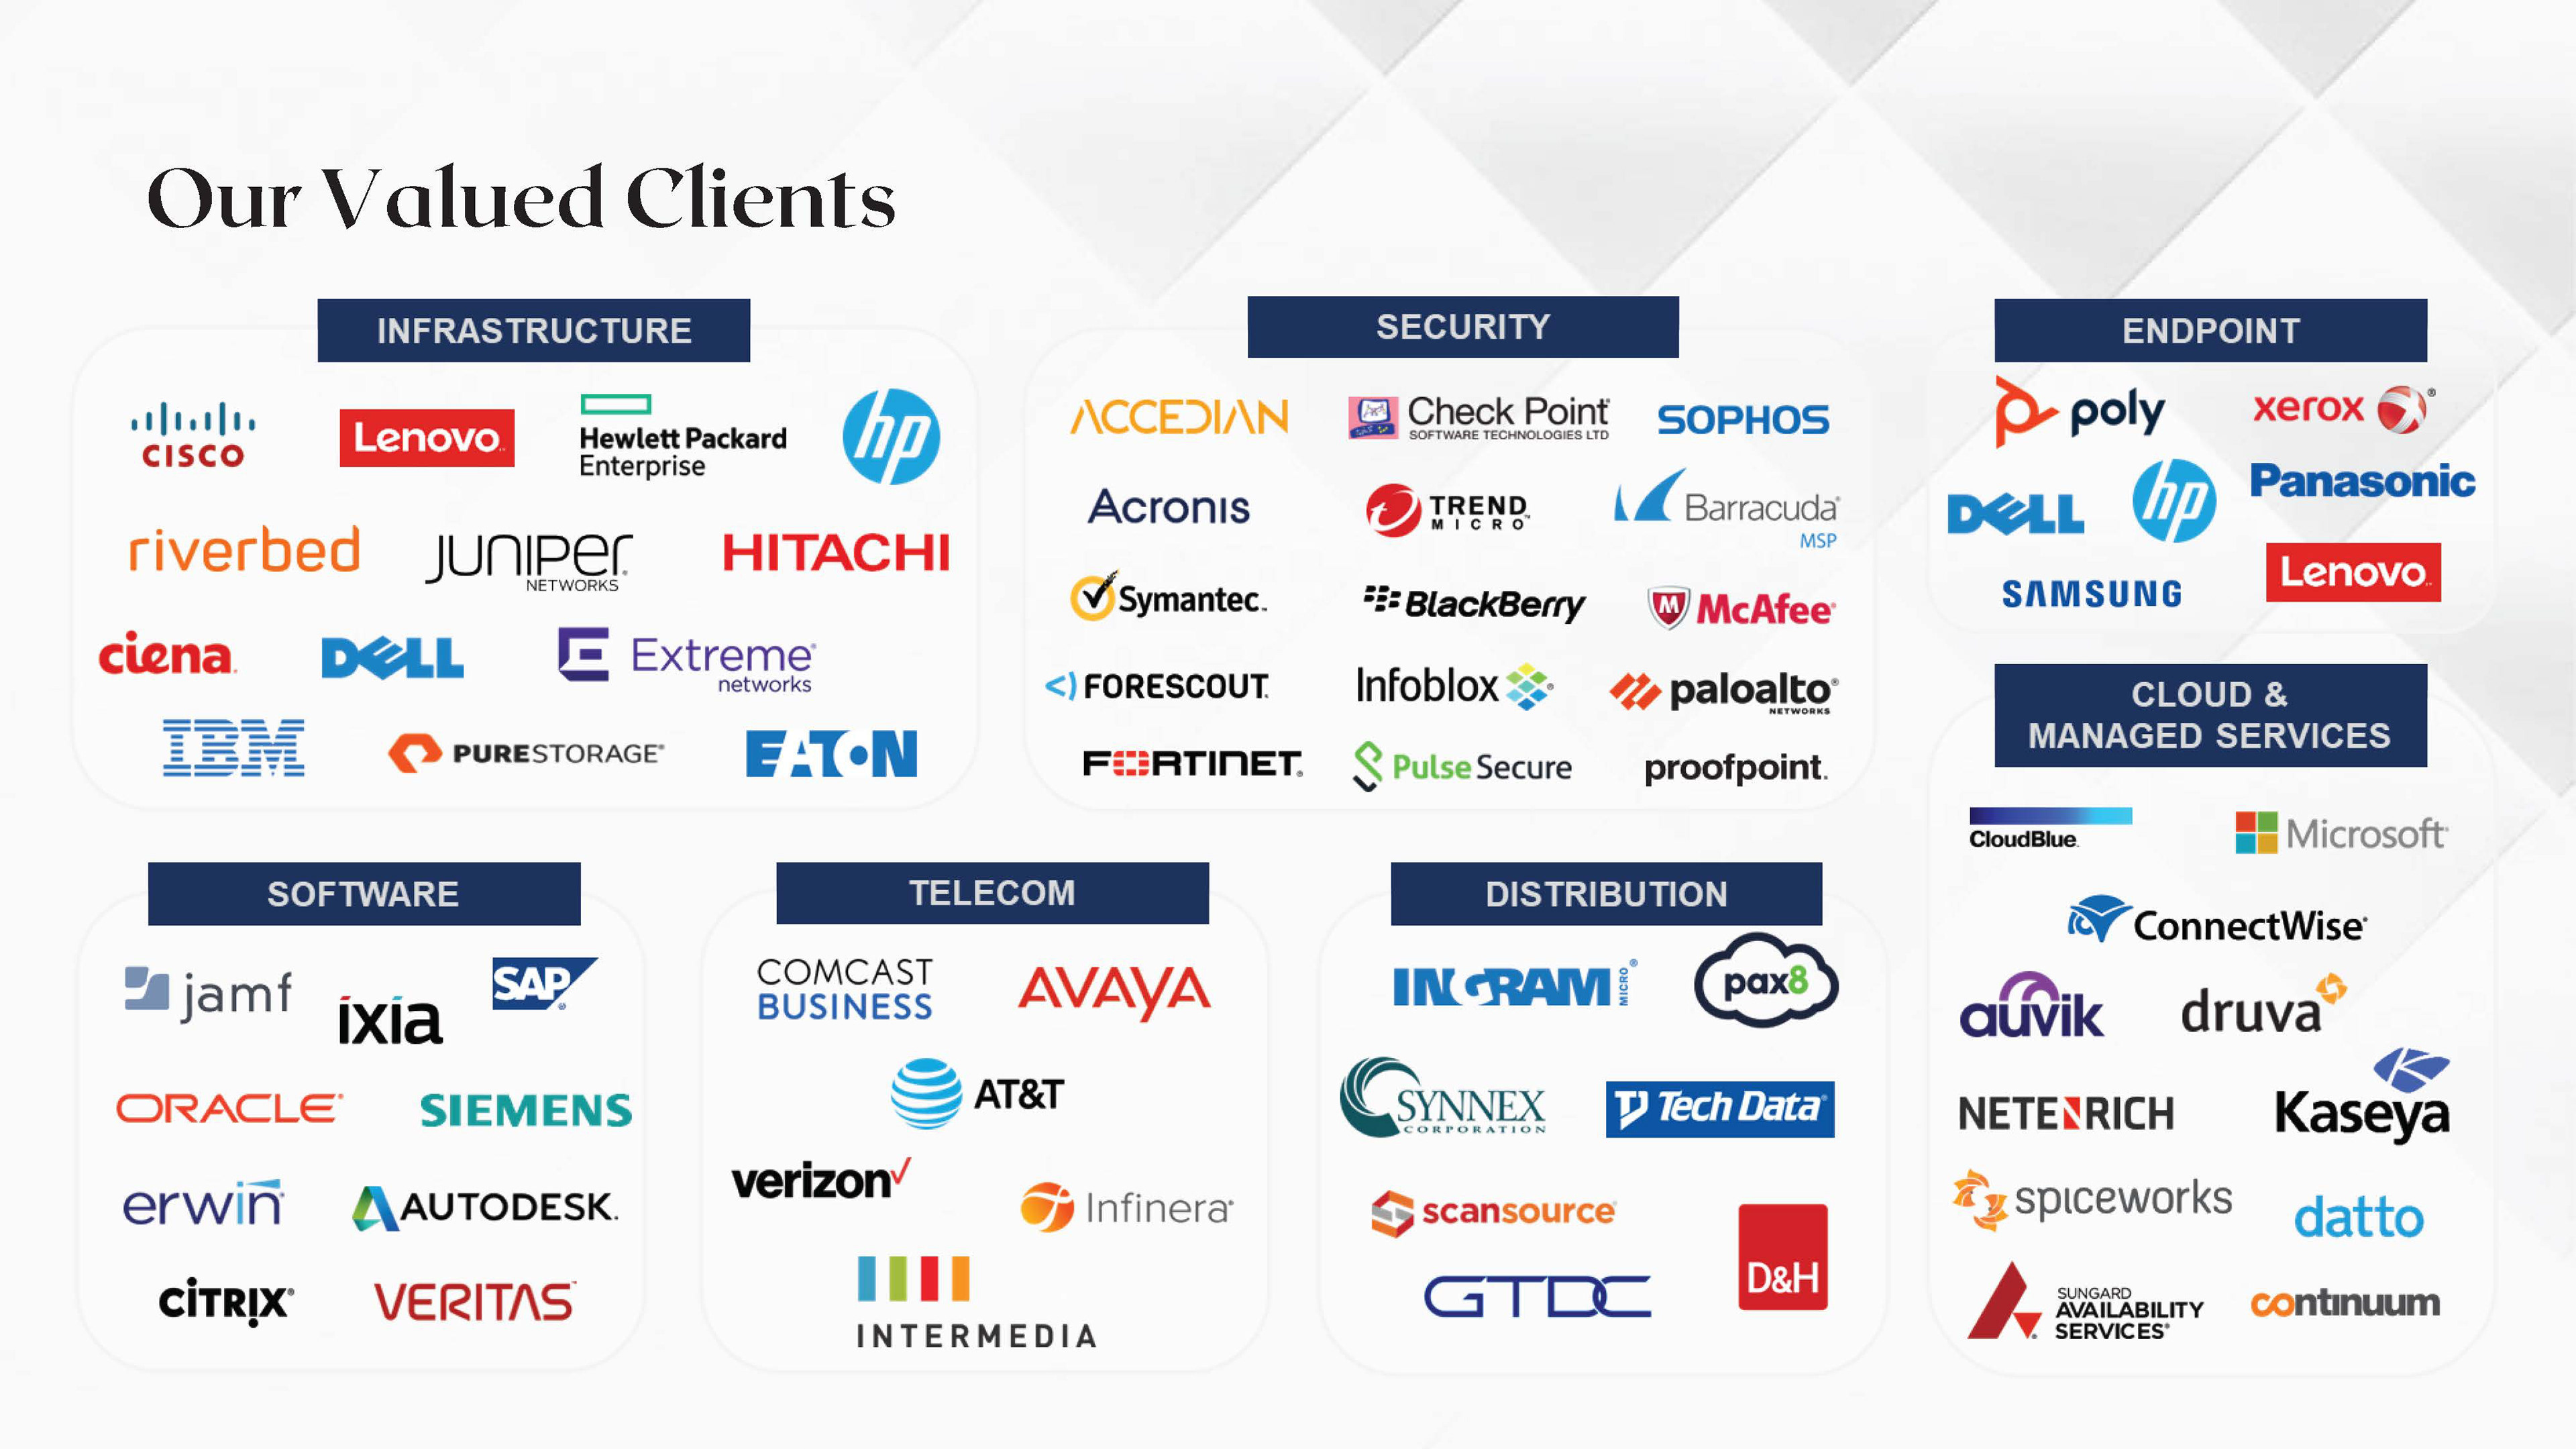
Presentation Design
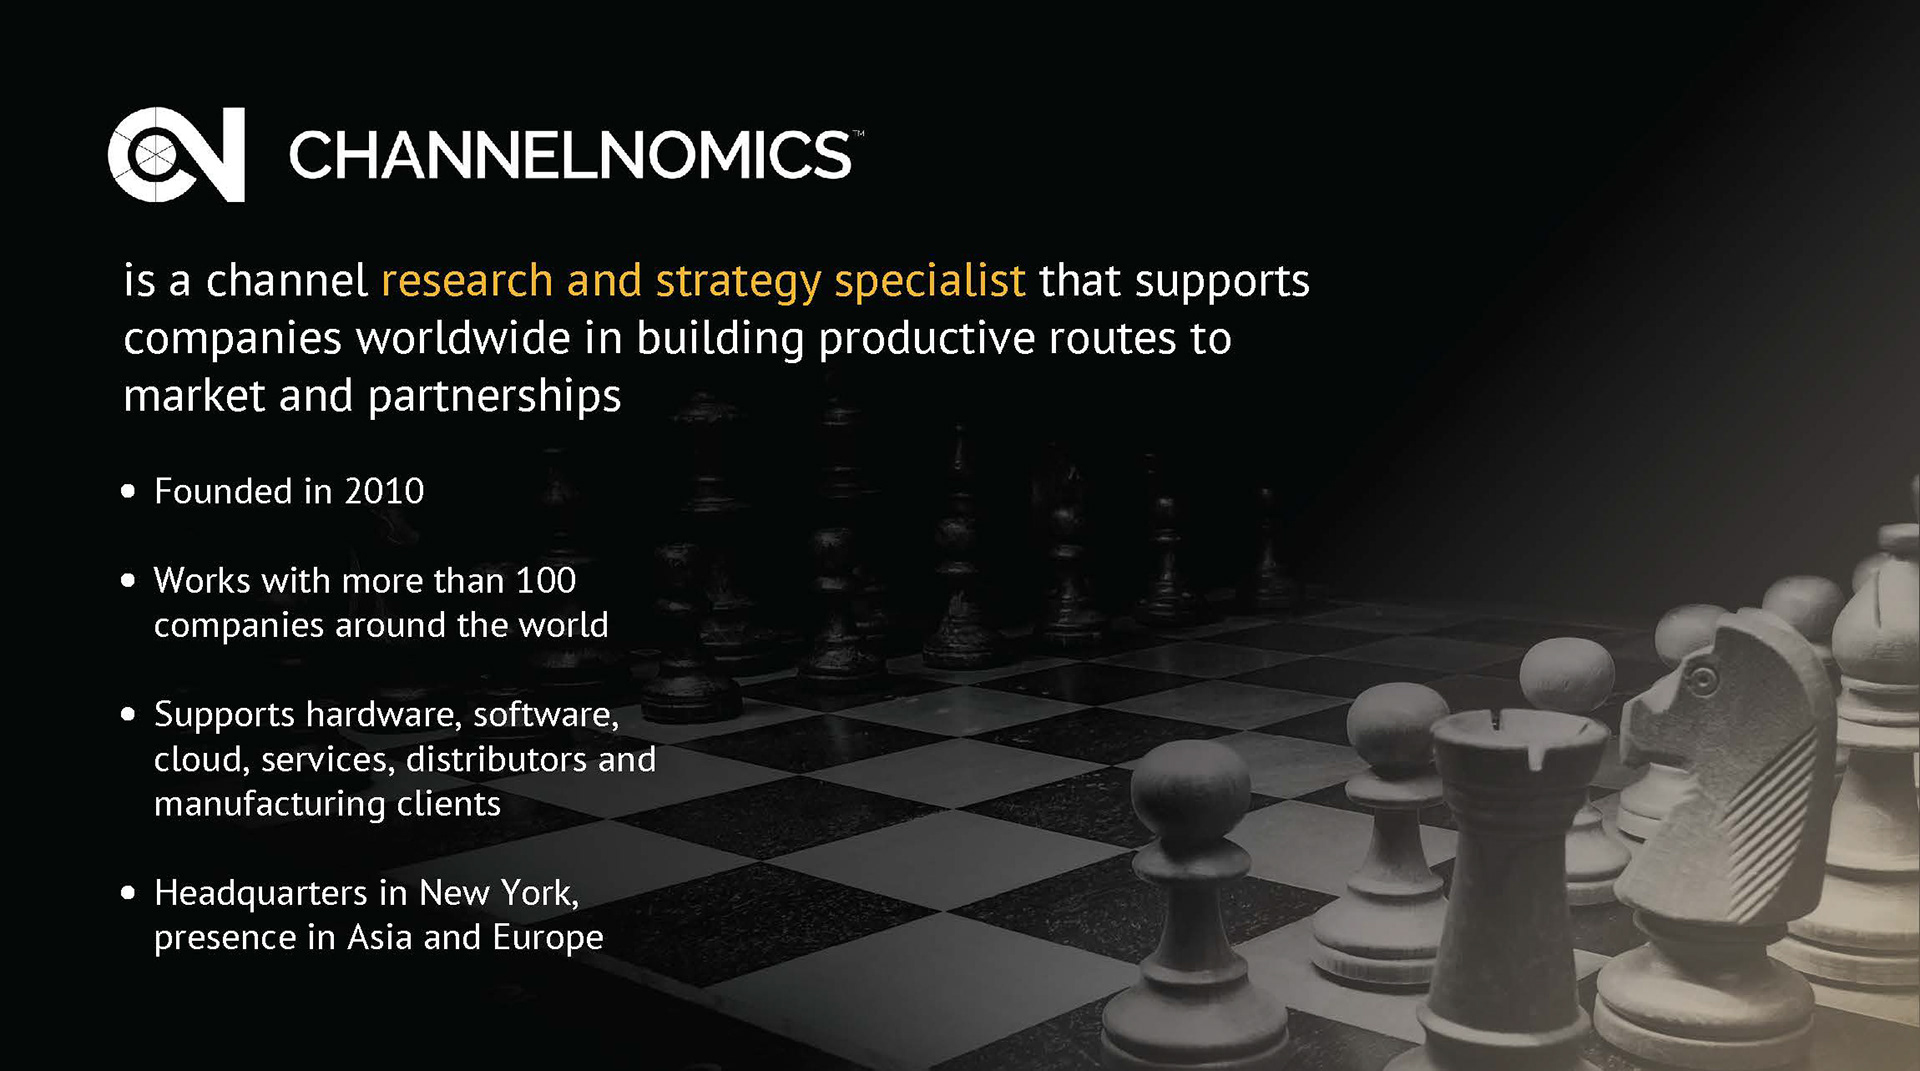
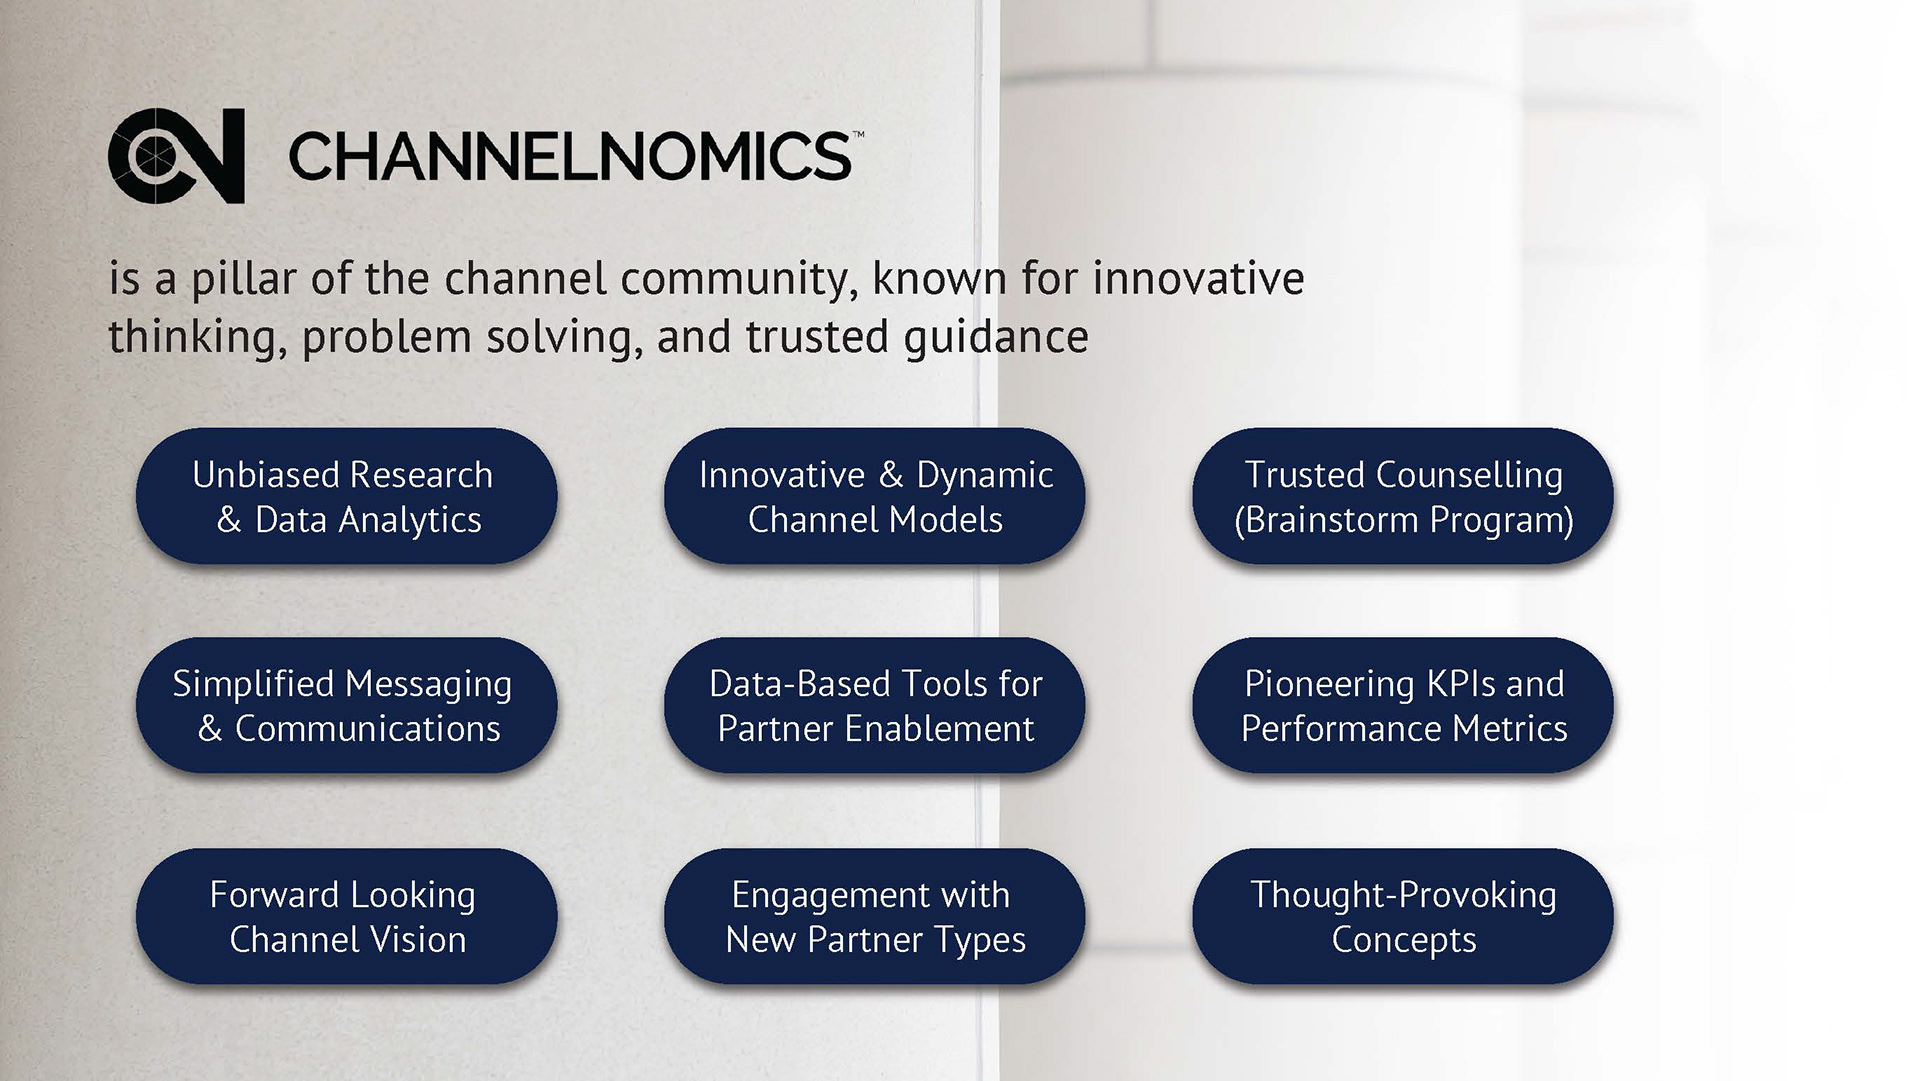
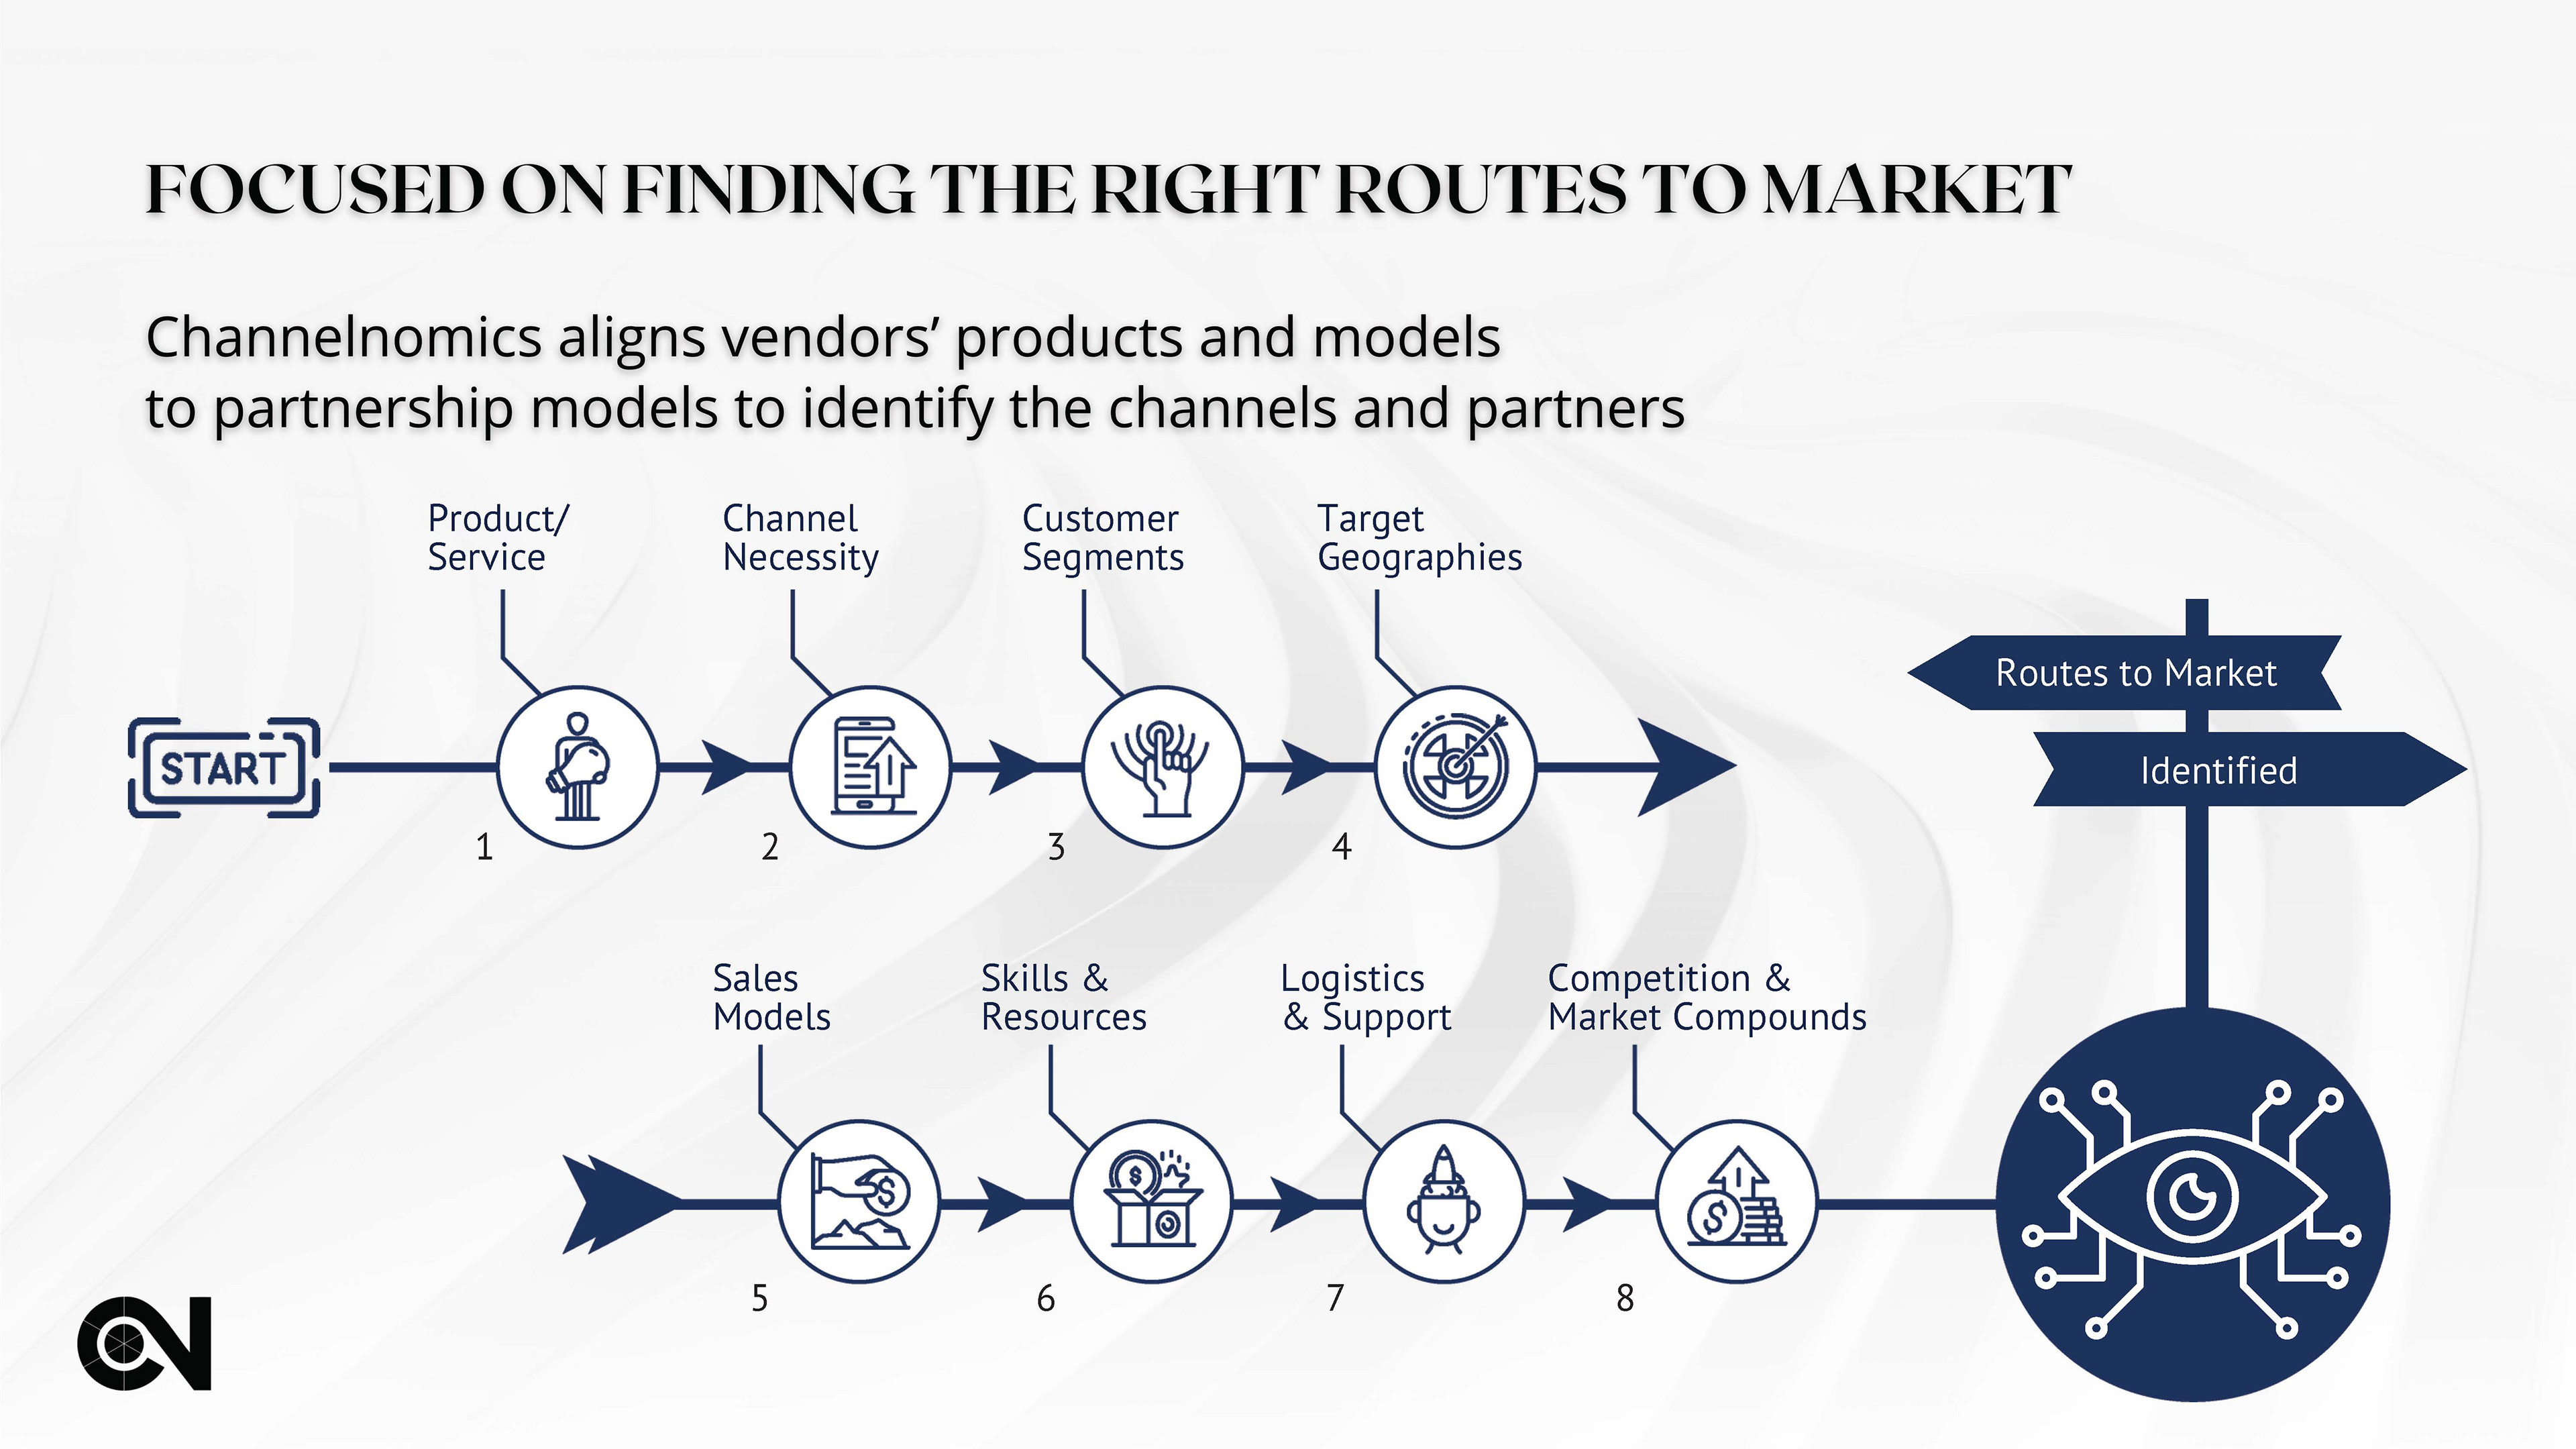
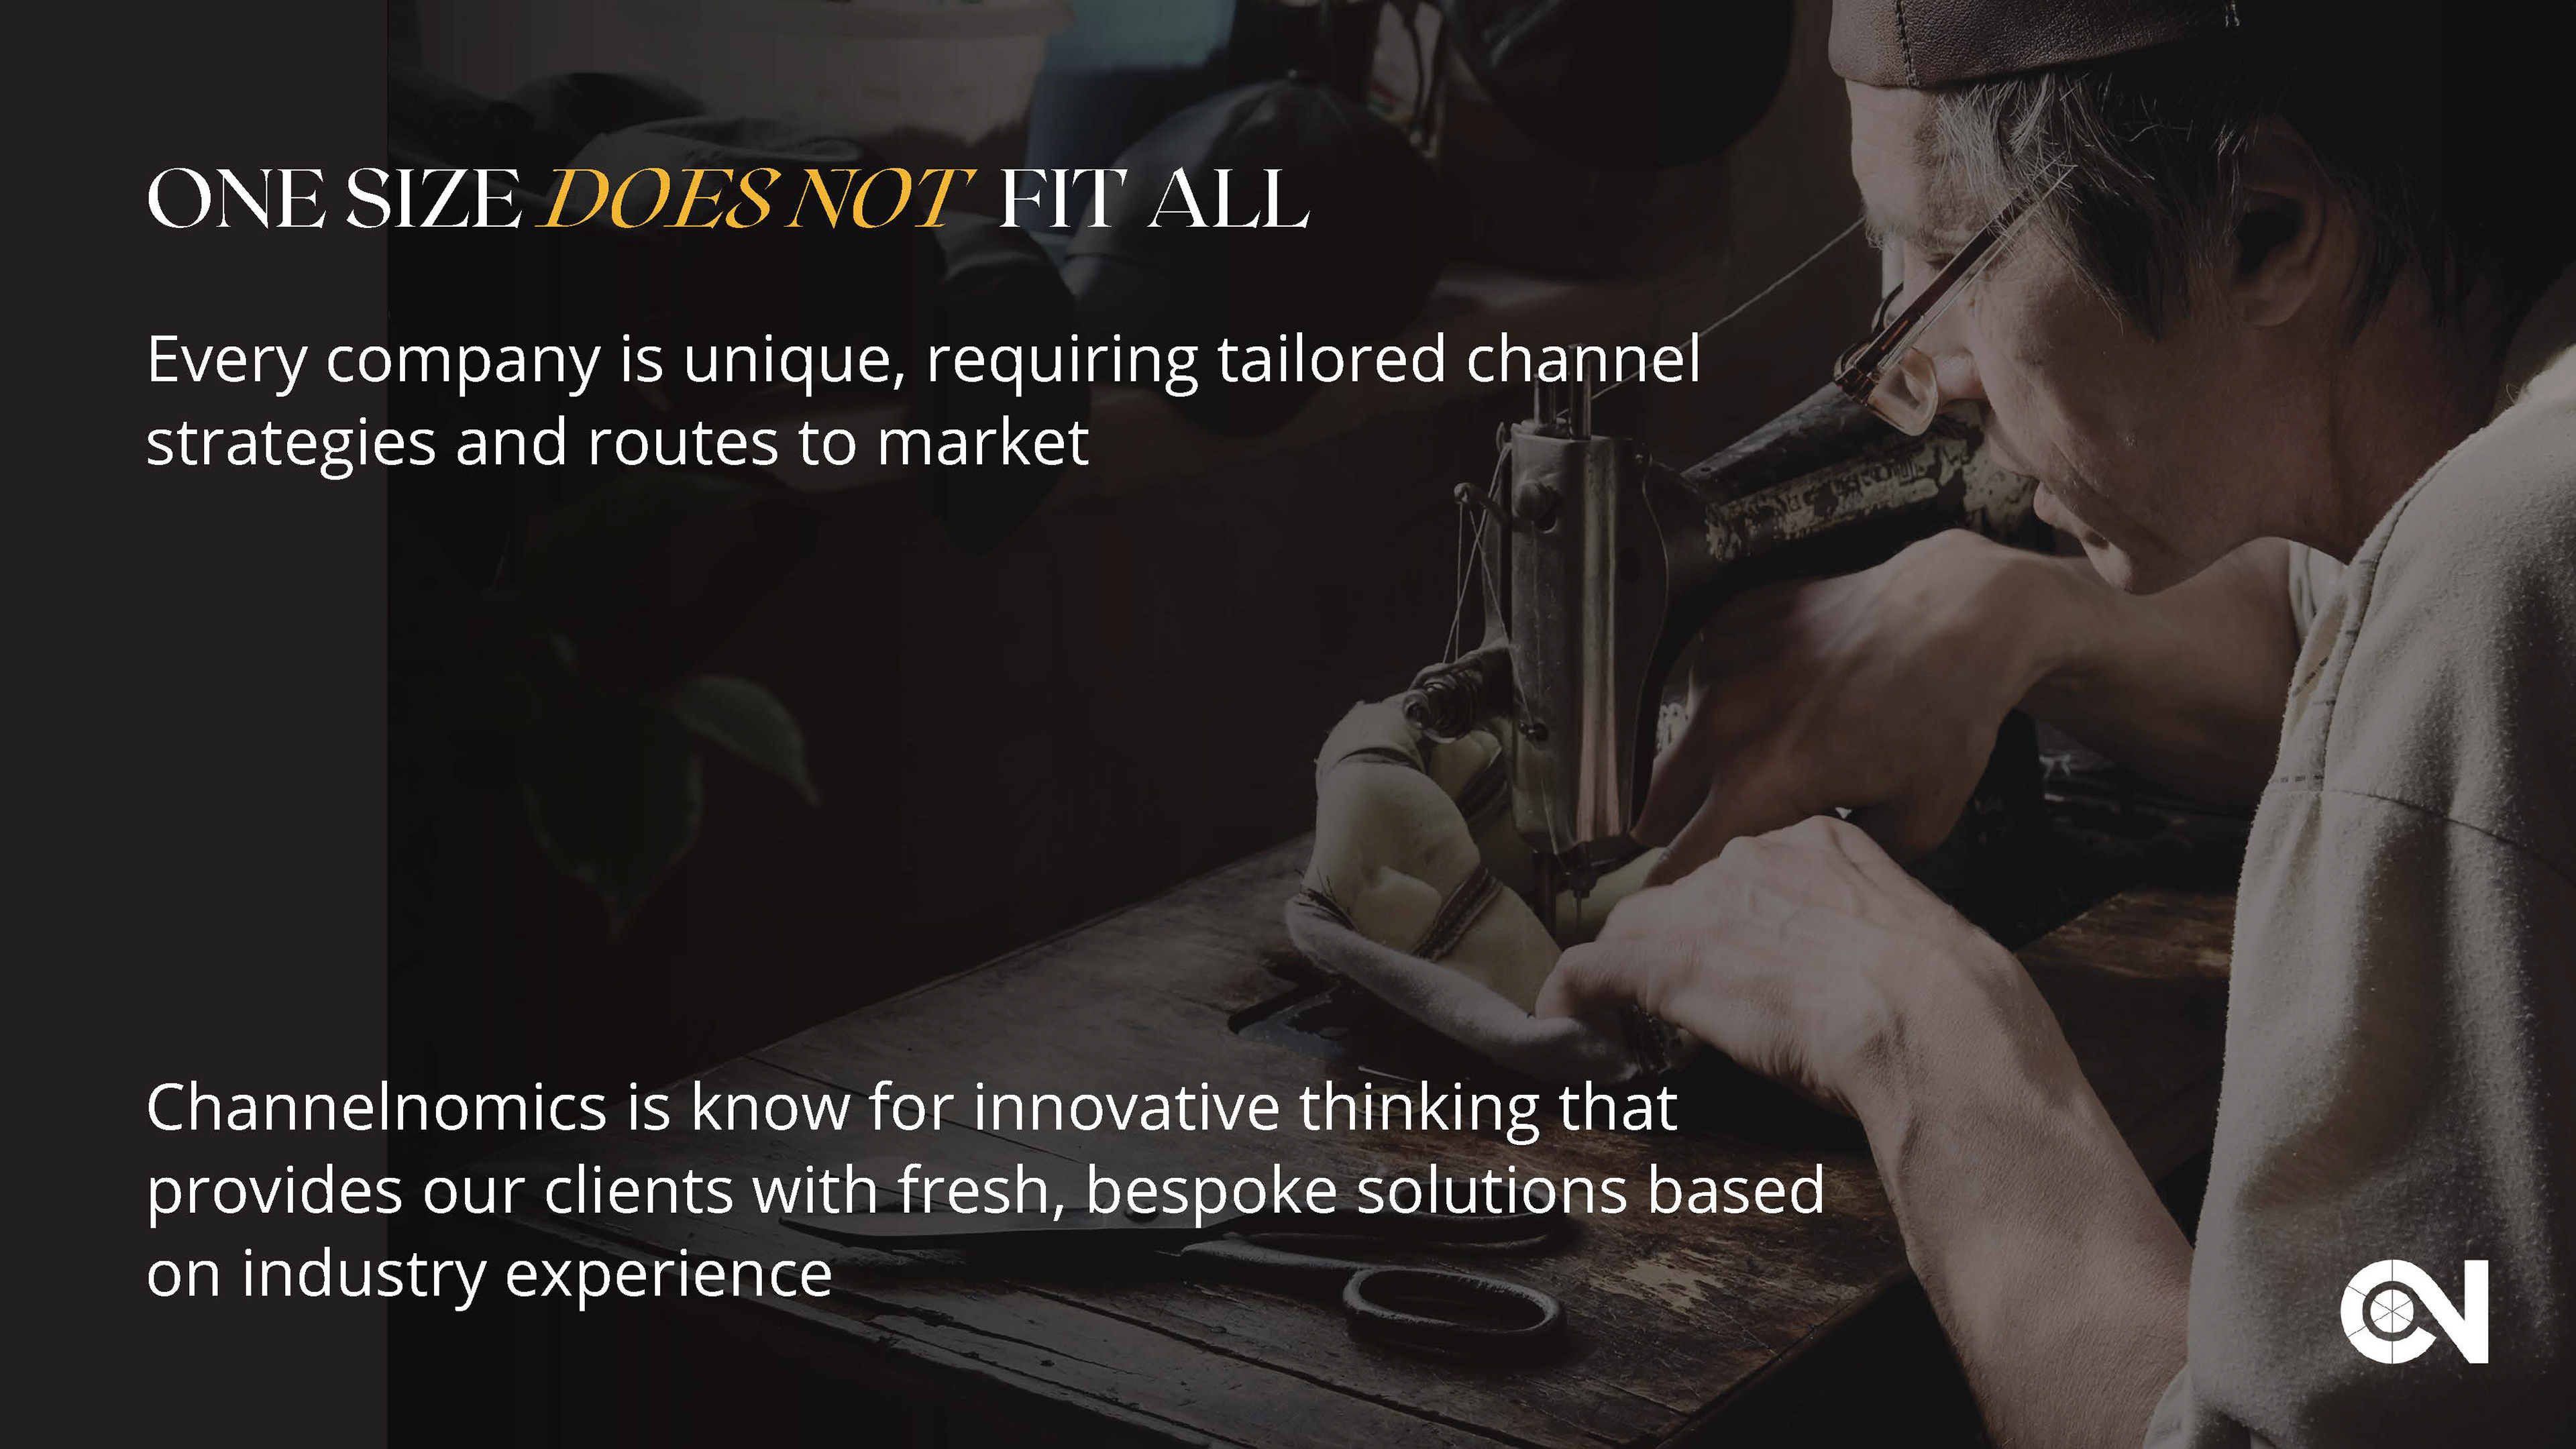
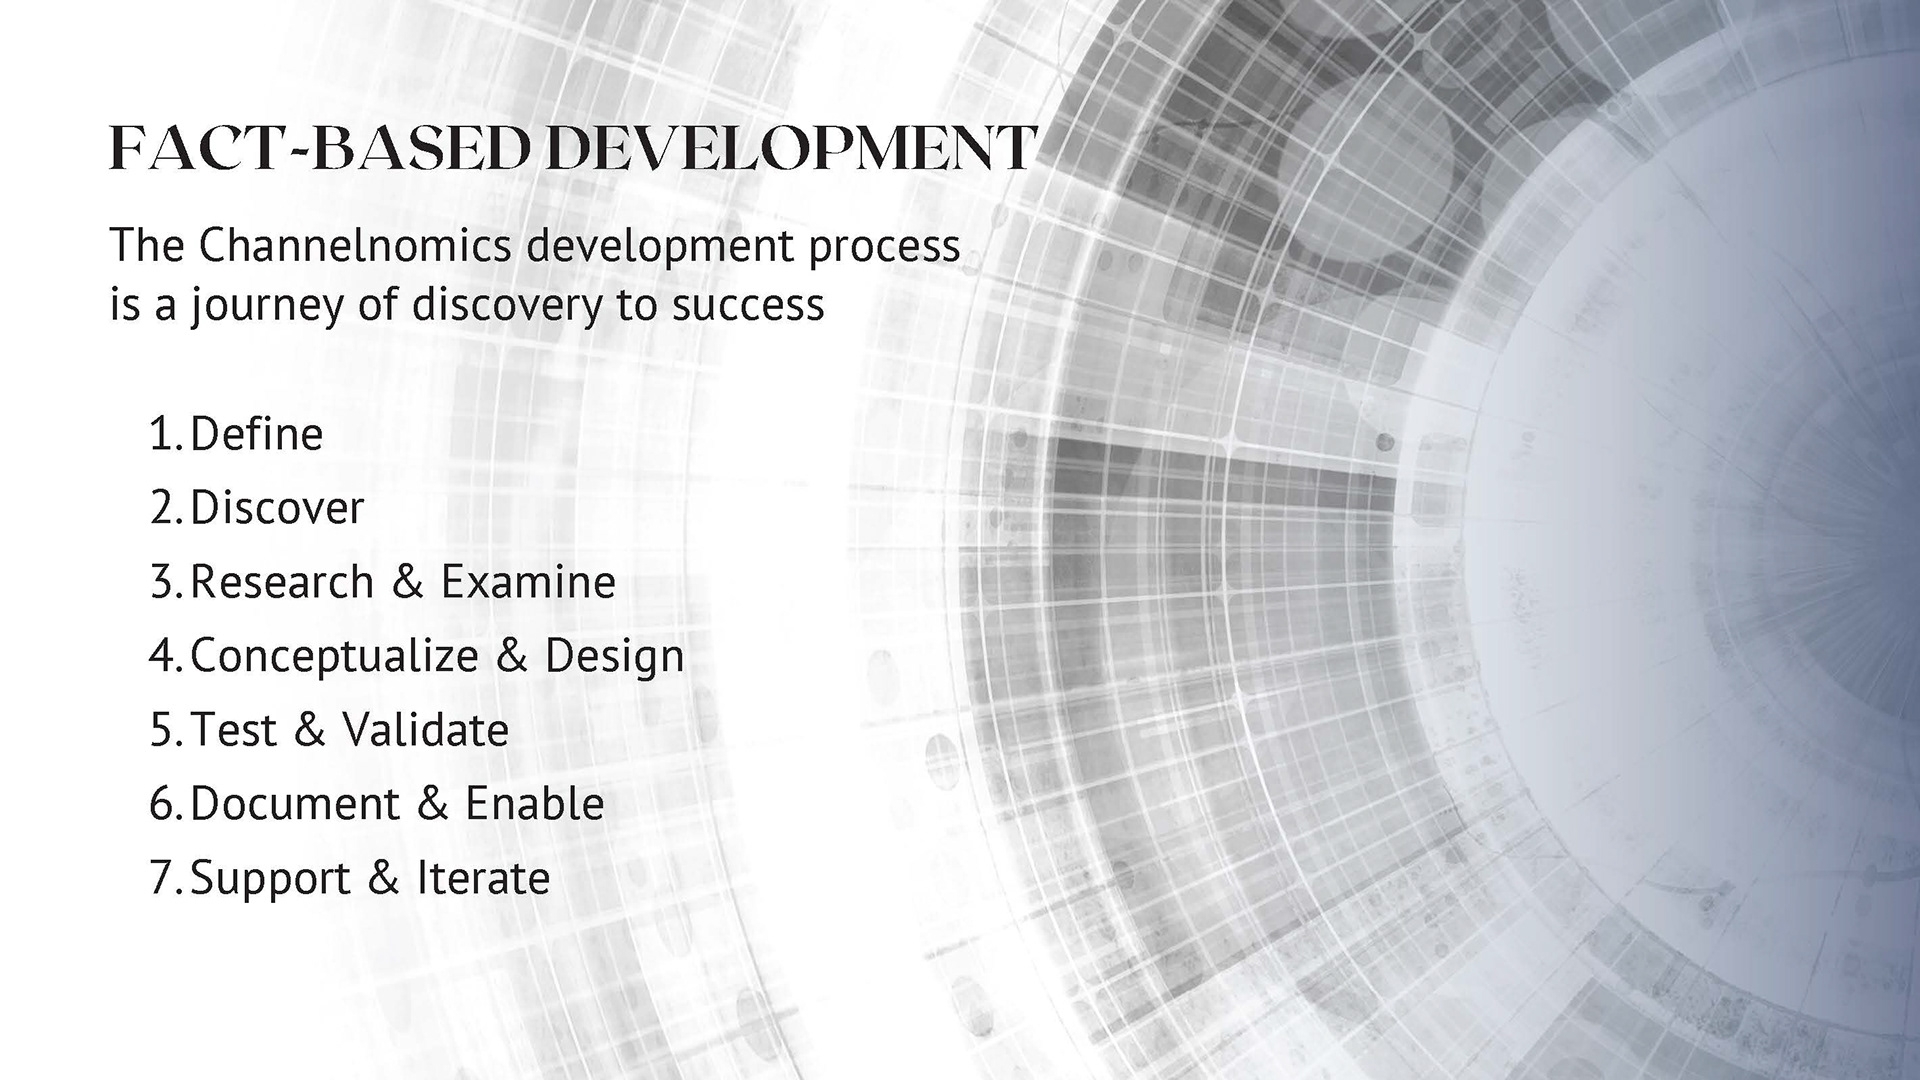
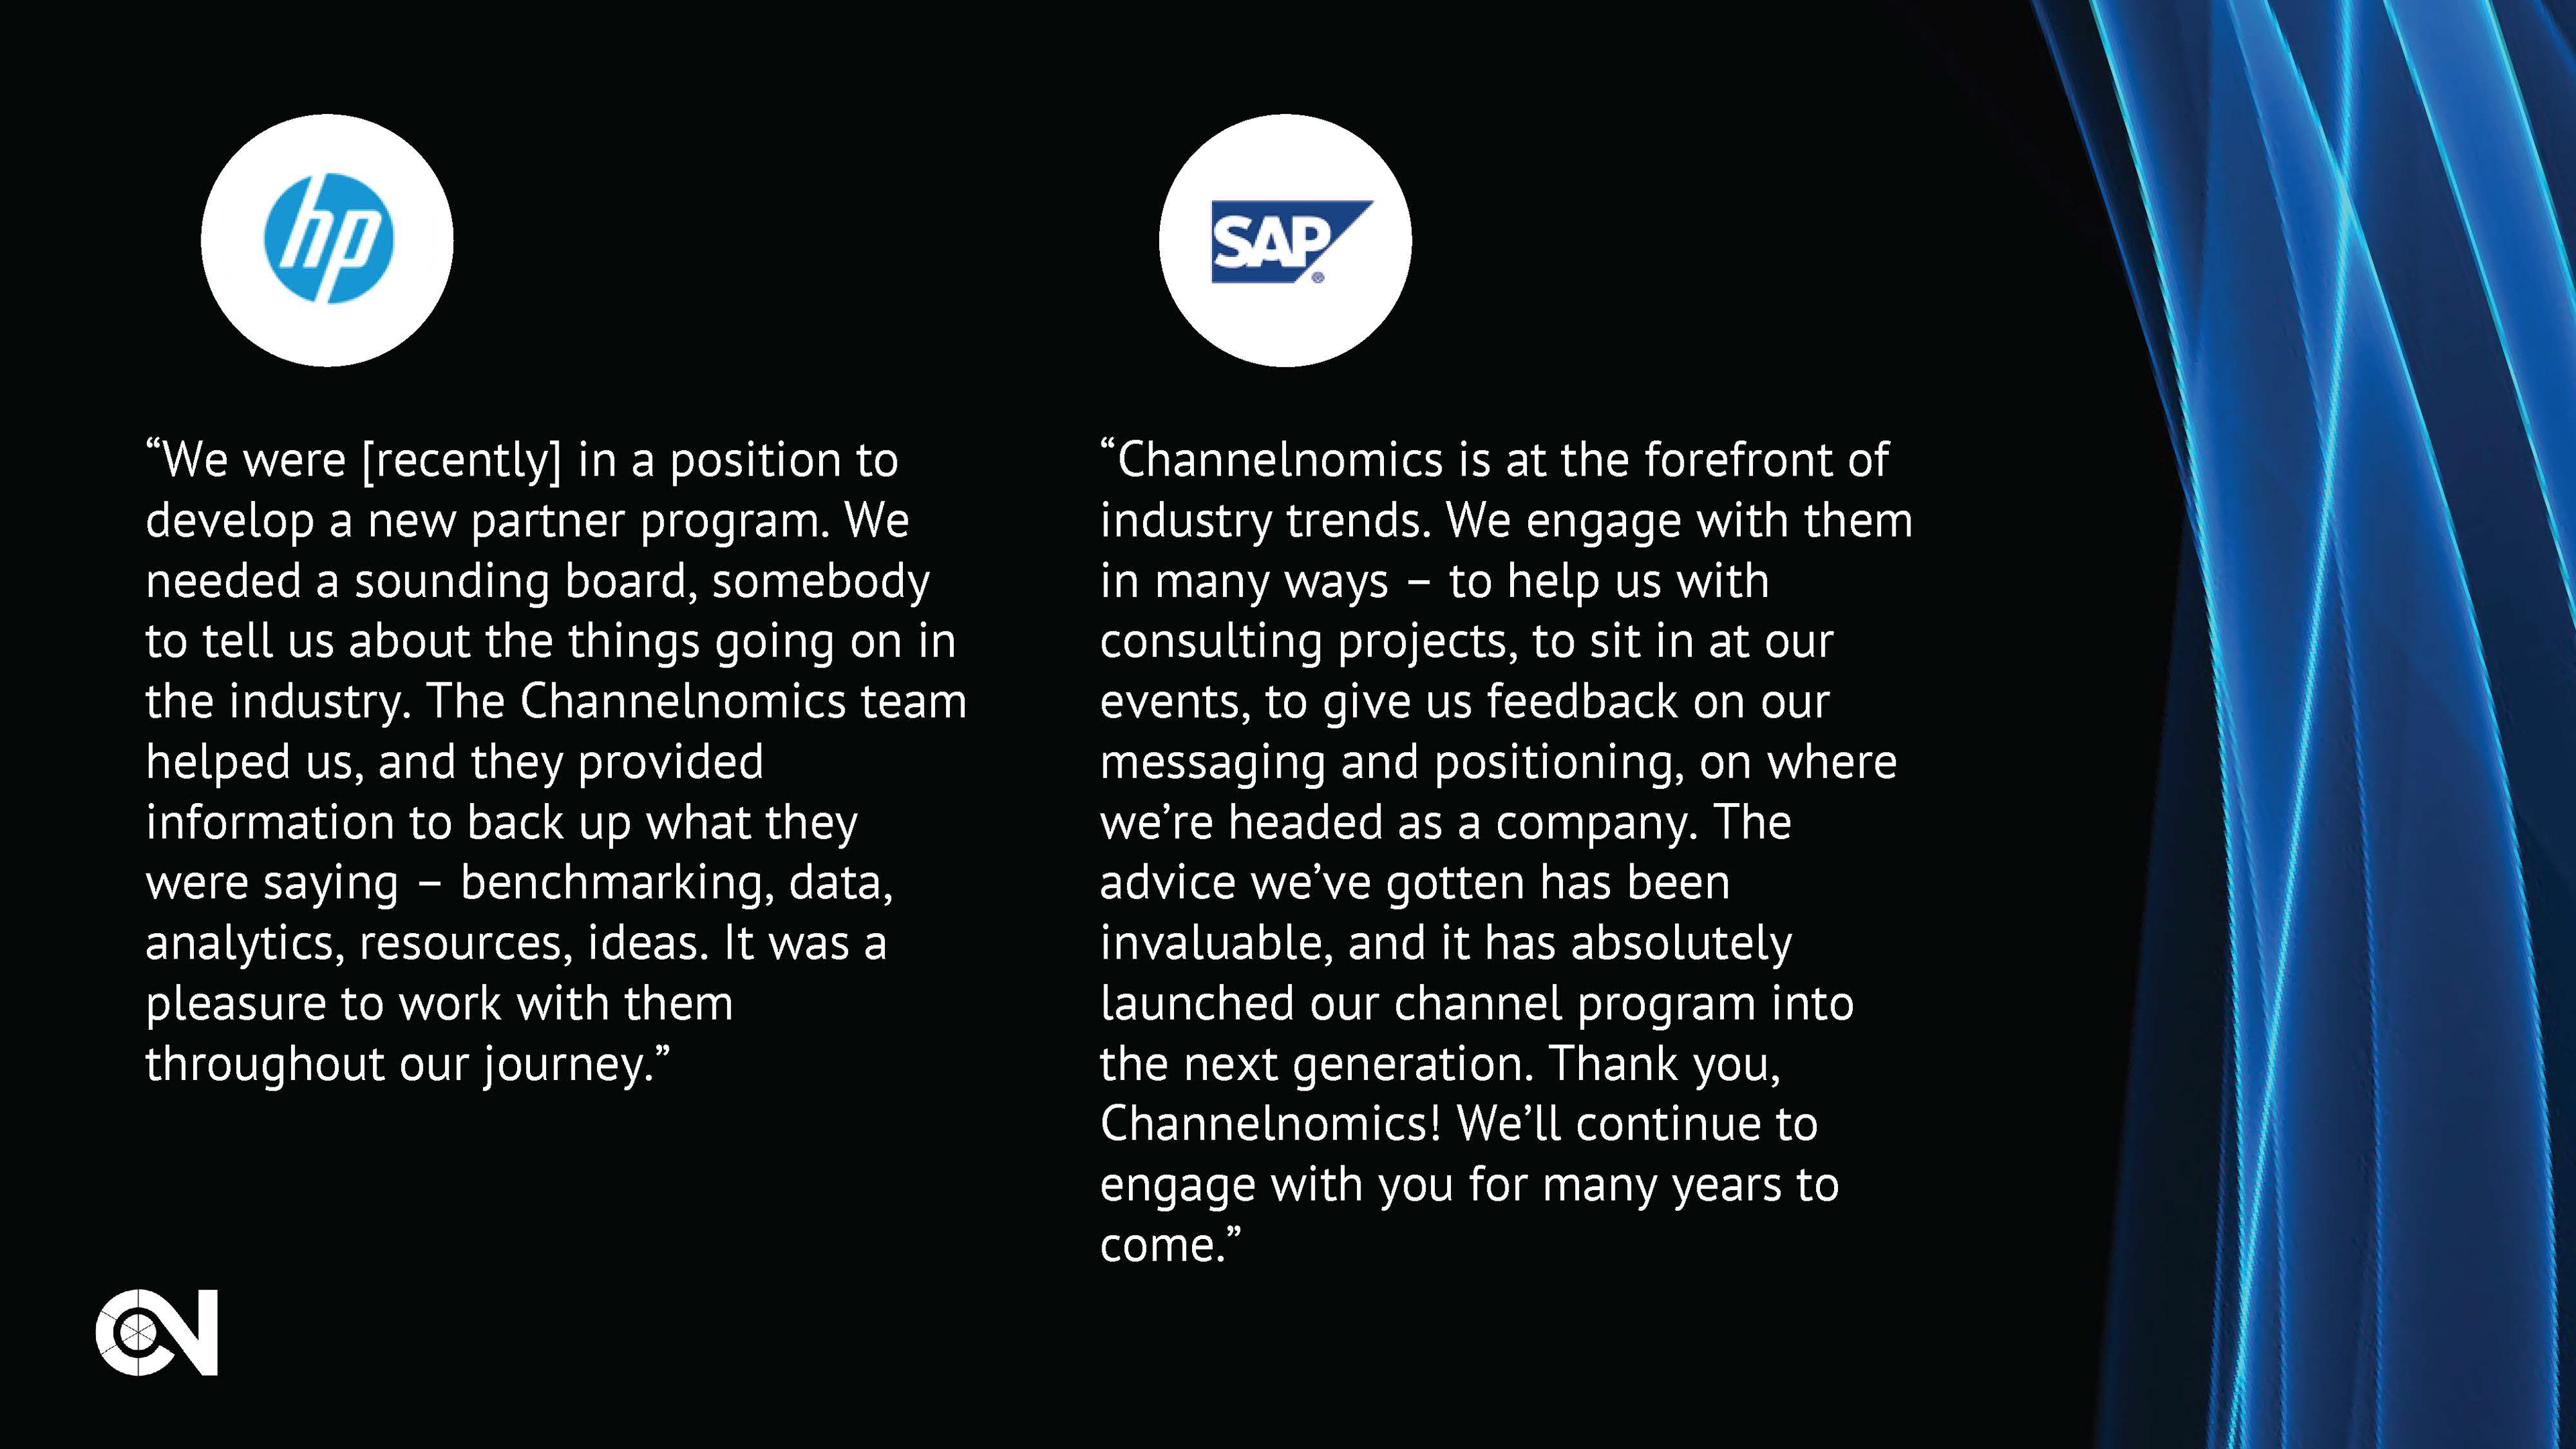
Whether given directly to clients or at conferences, Channelnomics gives many presentations. As a part of the larger branding initiative, I created presentation templates and guidelines for others to make their own while handling the larger and more important presentations myself. Below is the "Channelnomics Story Presentation" which discussed who the business is and what they do.


Infographics
By far the largest and most complex projects I worked on while at Channelnomics were infographics. I enjoyed these the most because of the creativity allowed through such data synthesis. Below are some examples from the Ingram IoT infographic project. This project involved 6 spotlights: cities, hospitals, manufacturing, retail, buildings, and warehouses. By creating more connectivity in the technology of these spaces, we are able to improve the personal experience, efficiency, environmental impact, and monetary outcomes.
I also got to incorporate many different presentation styles into this project. Using Adobe XD, I created interactive posters that could be viewed on a browser. Using Adobe InDesign, I designed interactive PDFs to be sent directly to clients. Also, using Adobe Illustrator, I constructed a scrollable variation that highlights how each spotlight is making positive changes in specific problem areas.
Use these links to view the XD browser versions and scroll below to see examples of the PDFs and Illustrator versions.